6 Burden query
6.1 Total Burdens
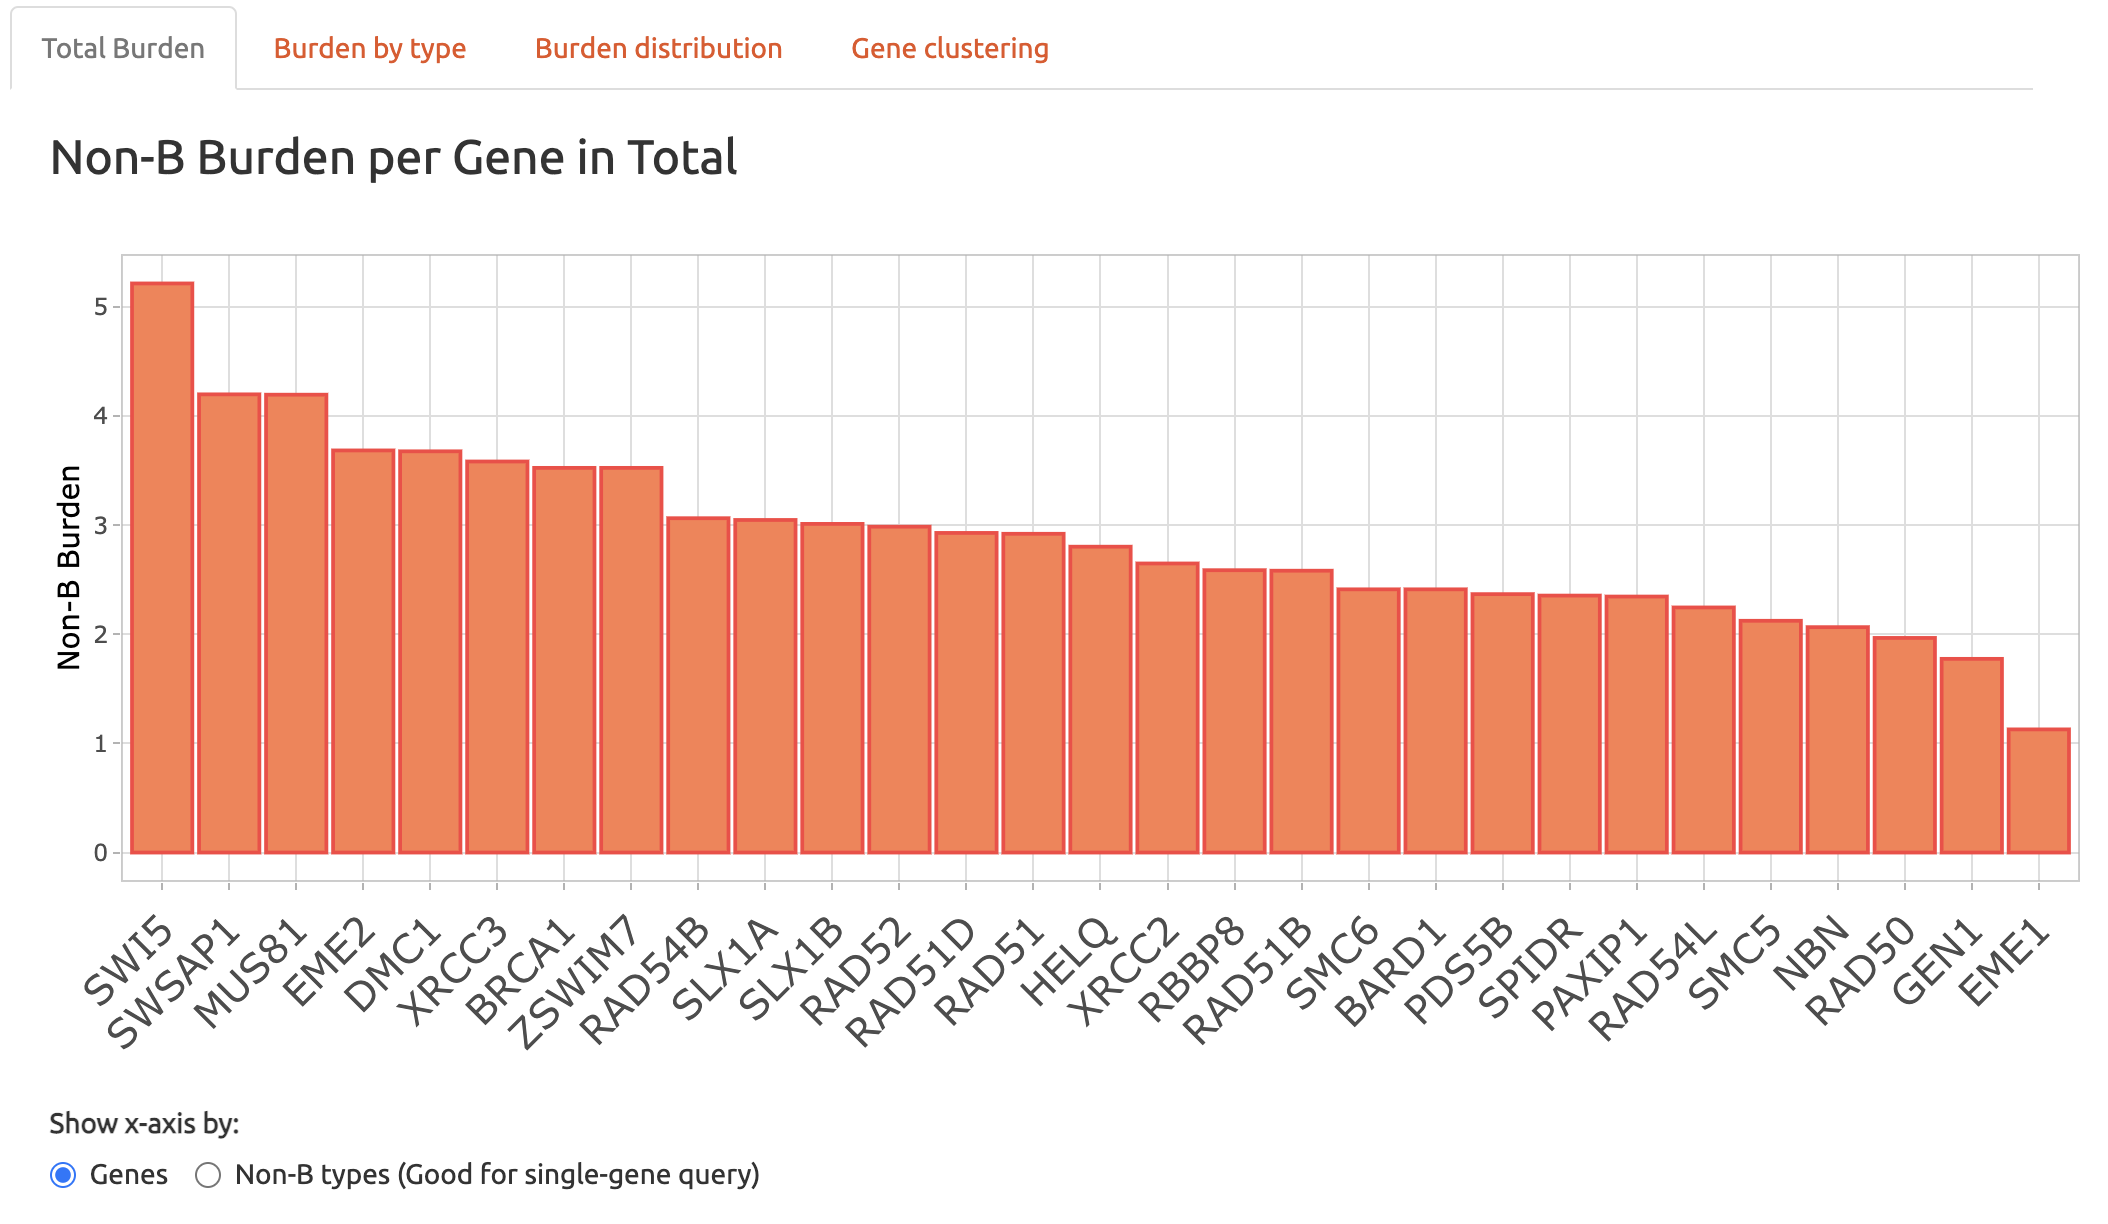
NBBC includes a Total Burdens plot that visualizes the total non-B burden in each gene as a bar plot. This visual provides users with a summary of the non-B burdens for each query unit.
Since this is an interactive plot, users can select hovers for more details of each data point. This feature allows users to obtain a more detailed understanding of the non-B burden for each gene in the query and can aid in identifying potential targets for further investigation.
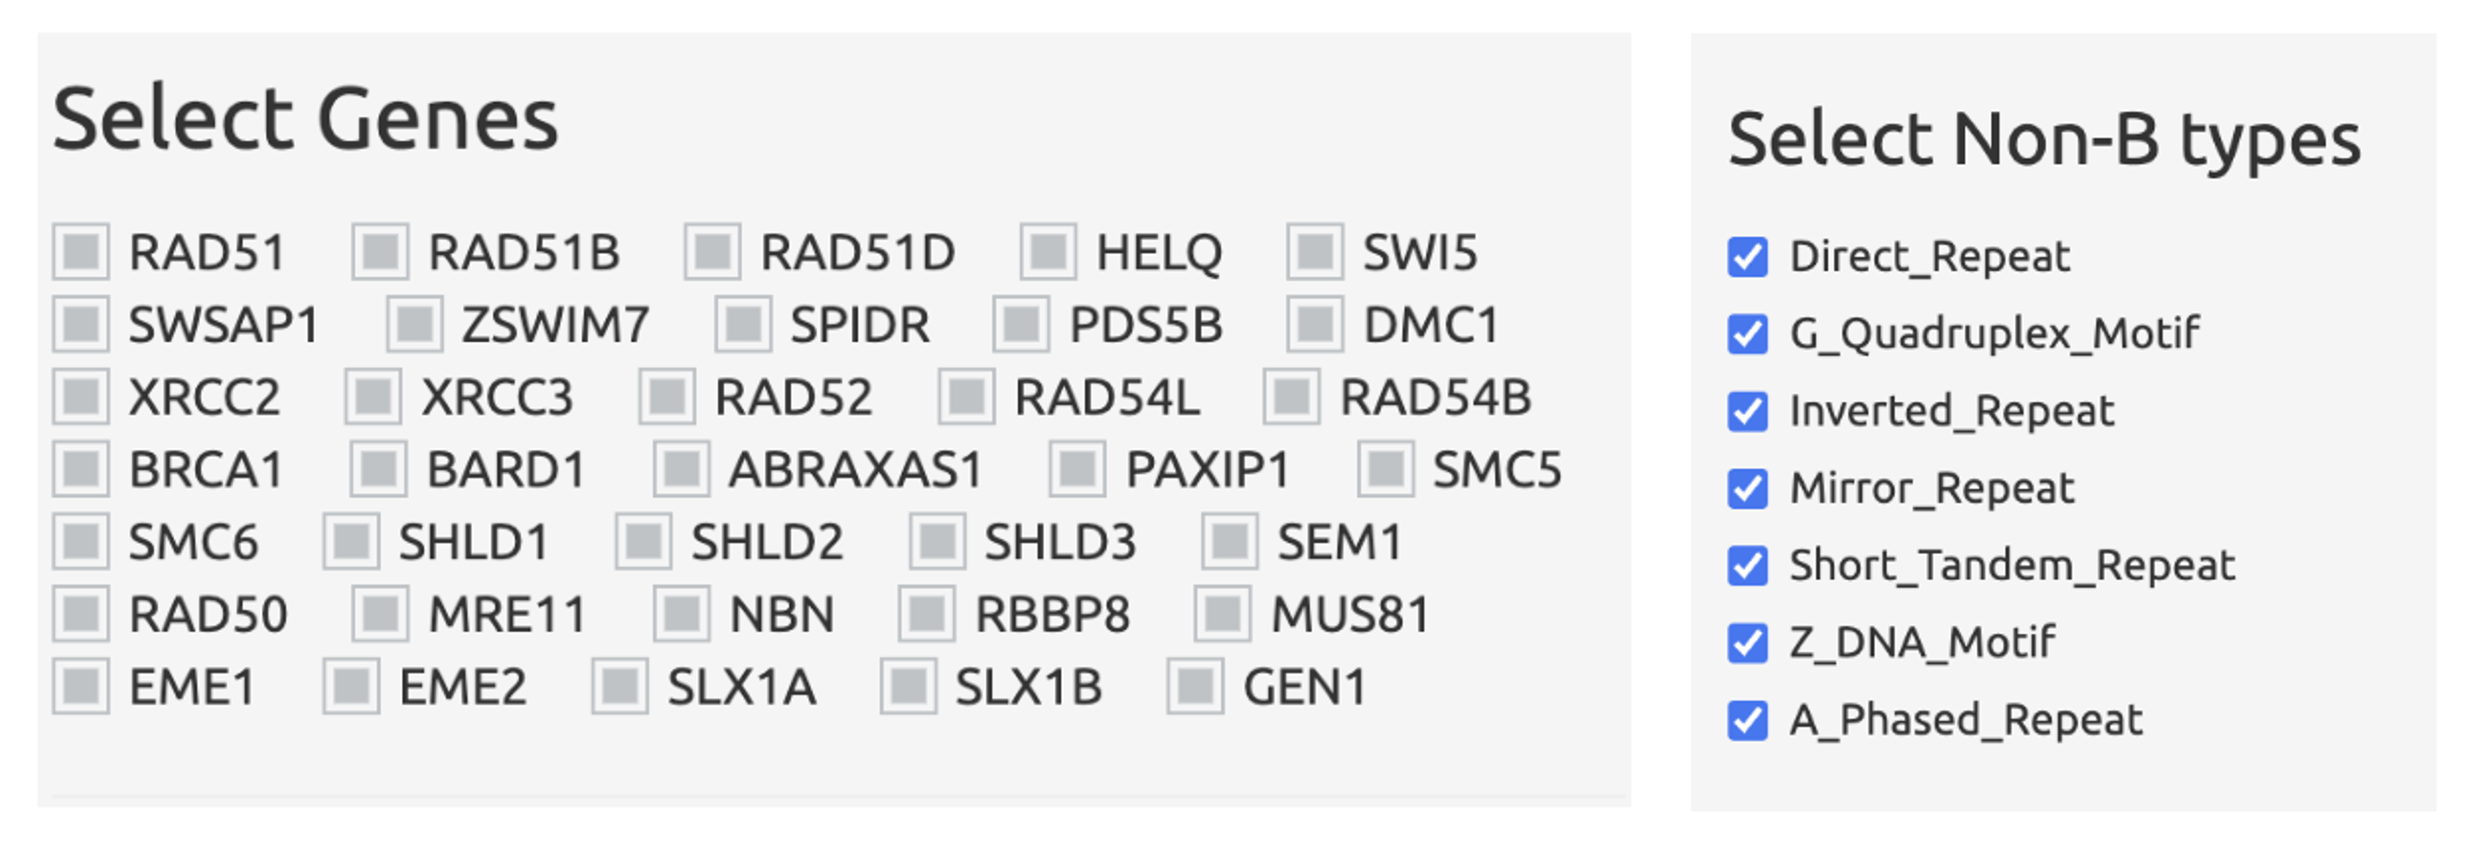
NBBC provides users with the option to display only a subset of genes or non-B types in the Total Burdens plot.
Additionally, users can choose to use either “Non-B types” or “Genes” as the X-axis to explore non-B burden.
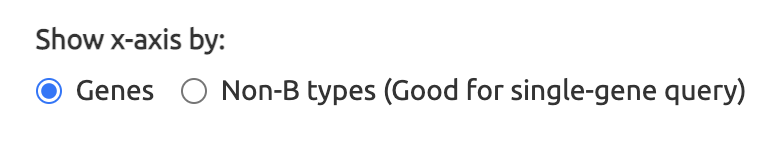
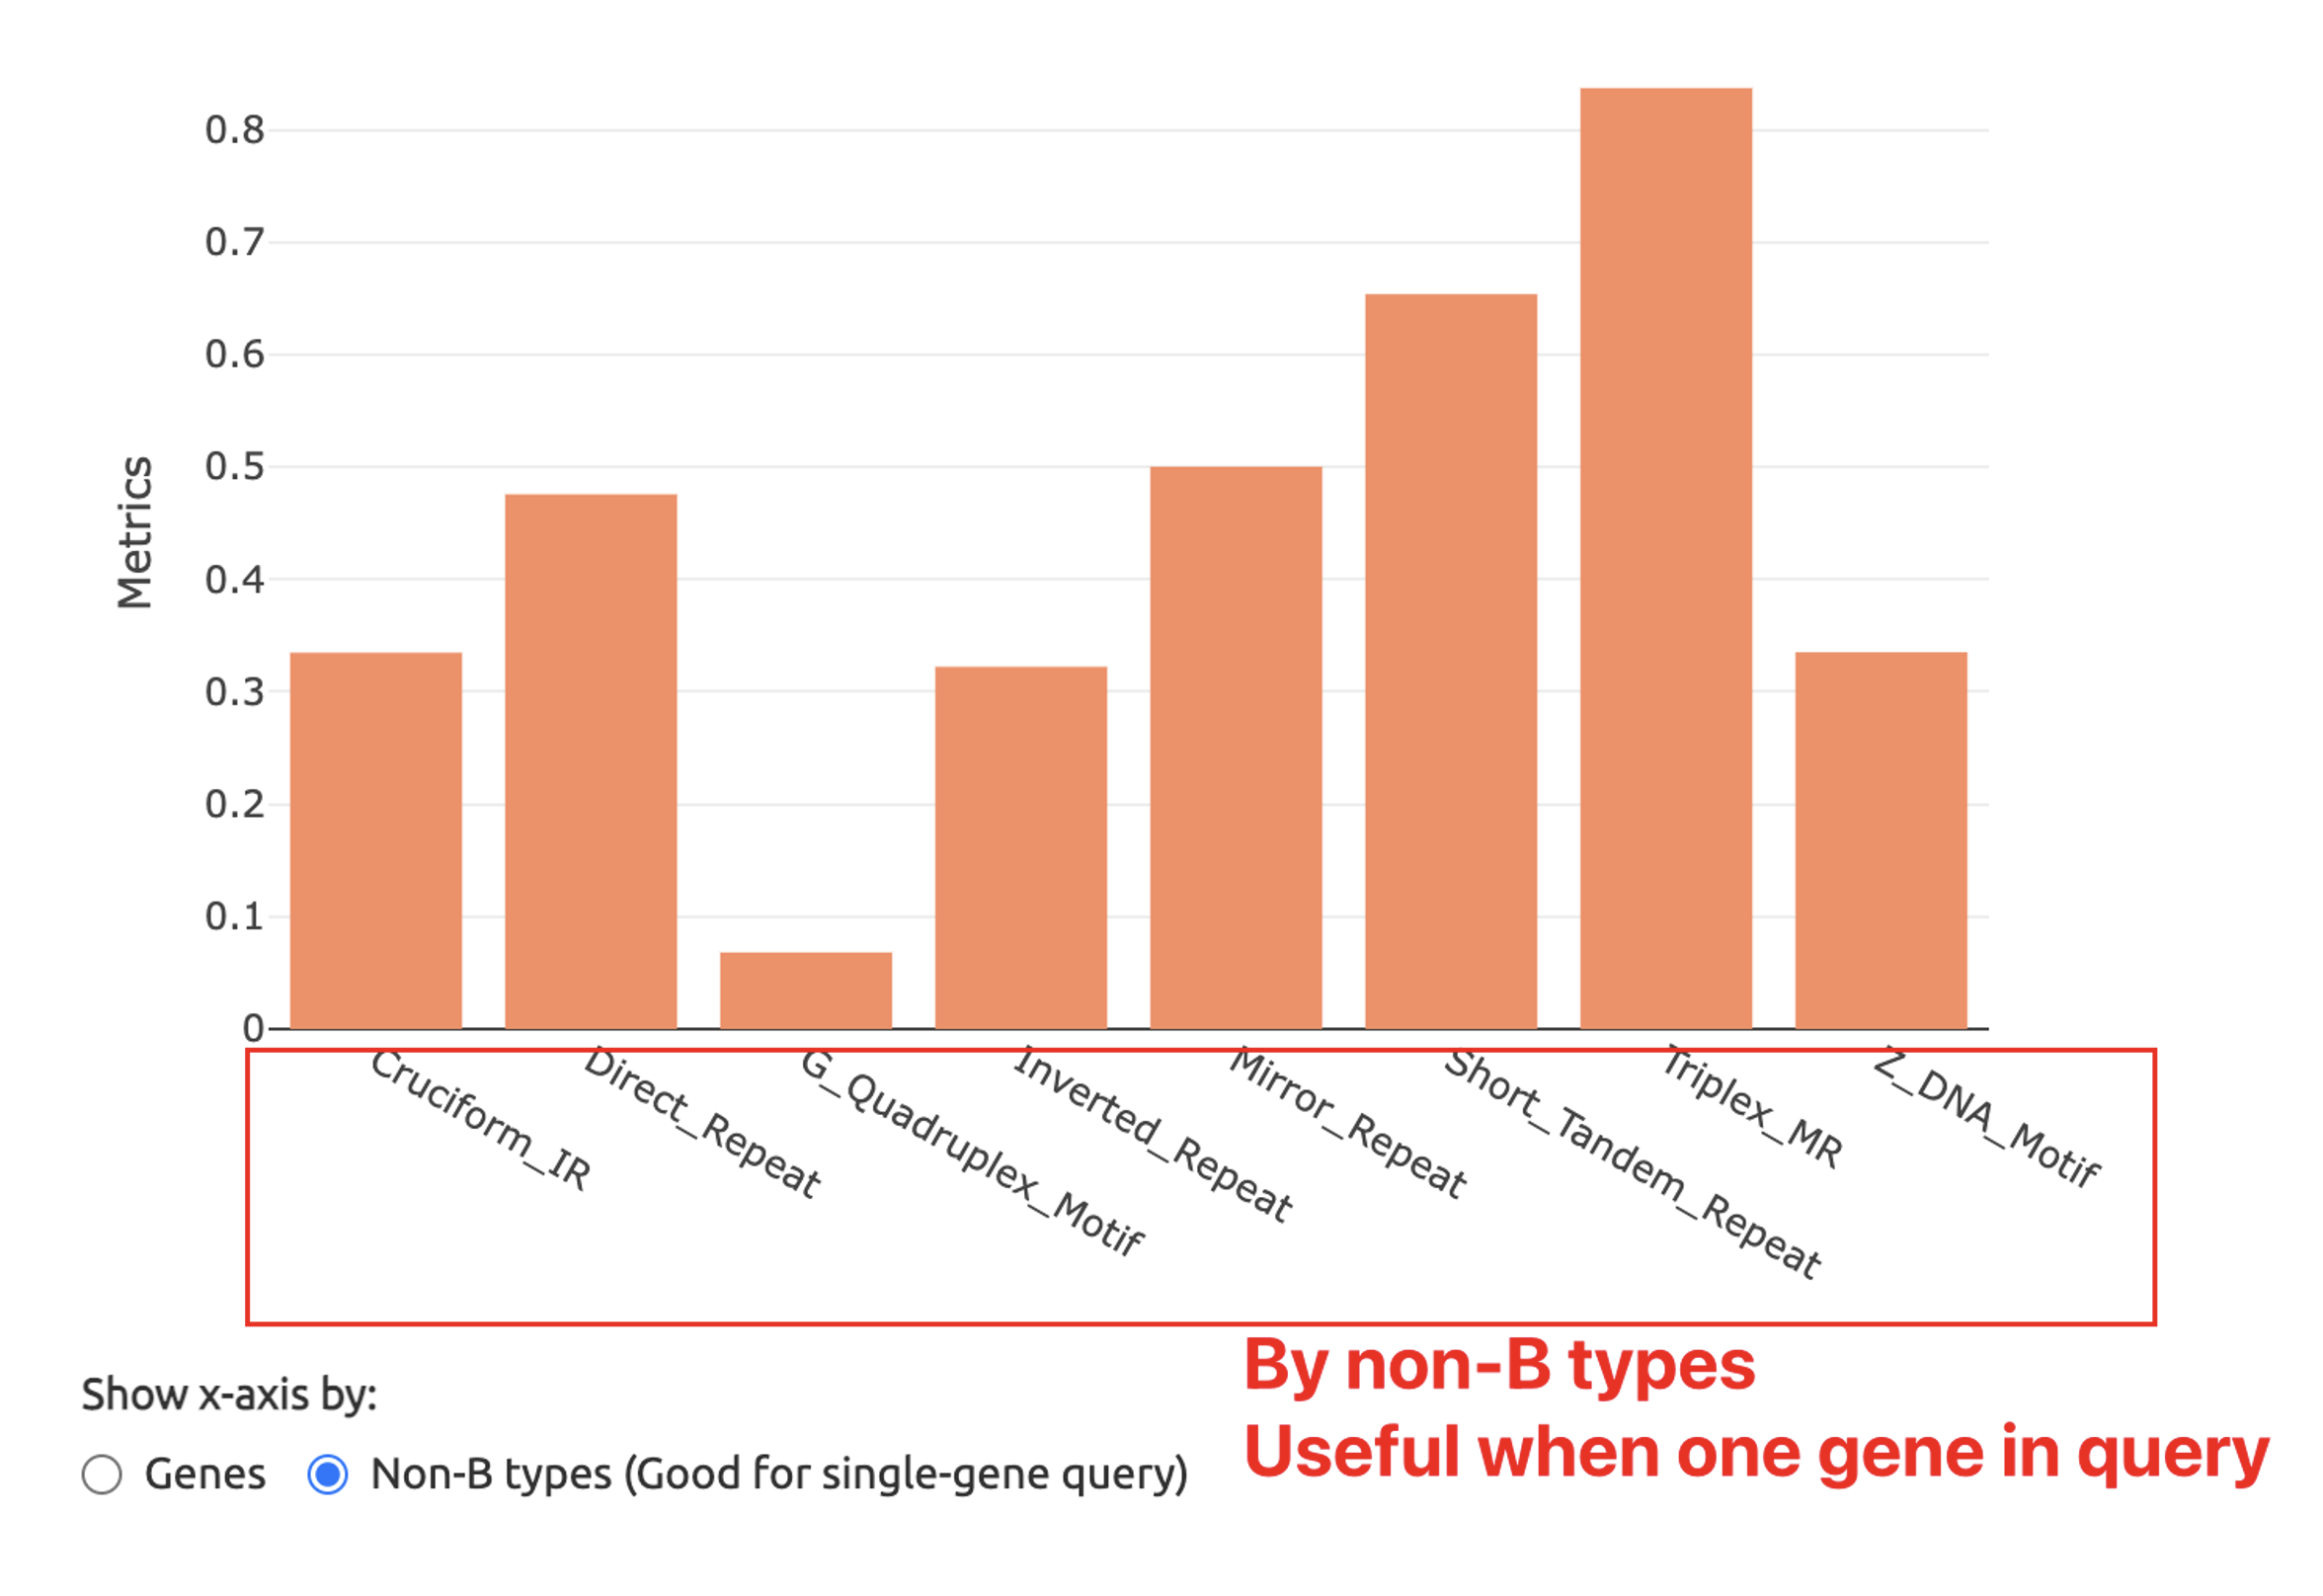
This flexible functionality allows users to tailor their analysis to their specific research needs and enables them to focus on the genes or non-B types of interest. By providing this level of customization, NBBC allows for more efficient and targeted exploration of non-B burden in the context of cancer research.
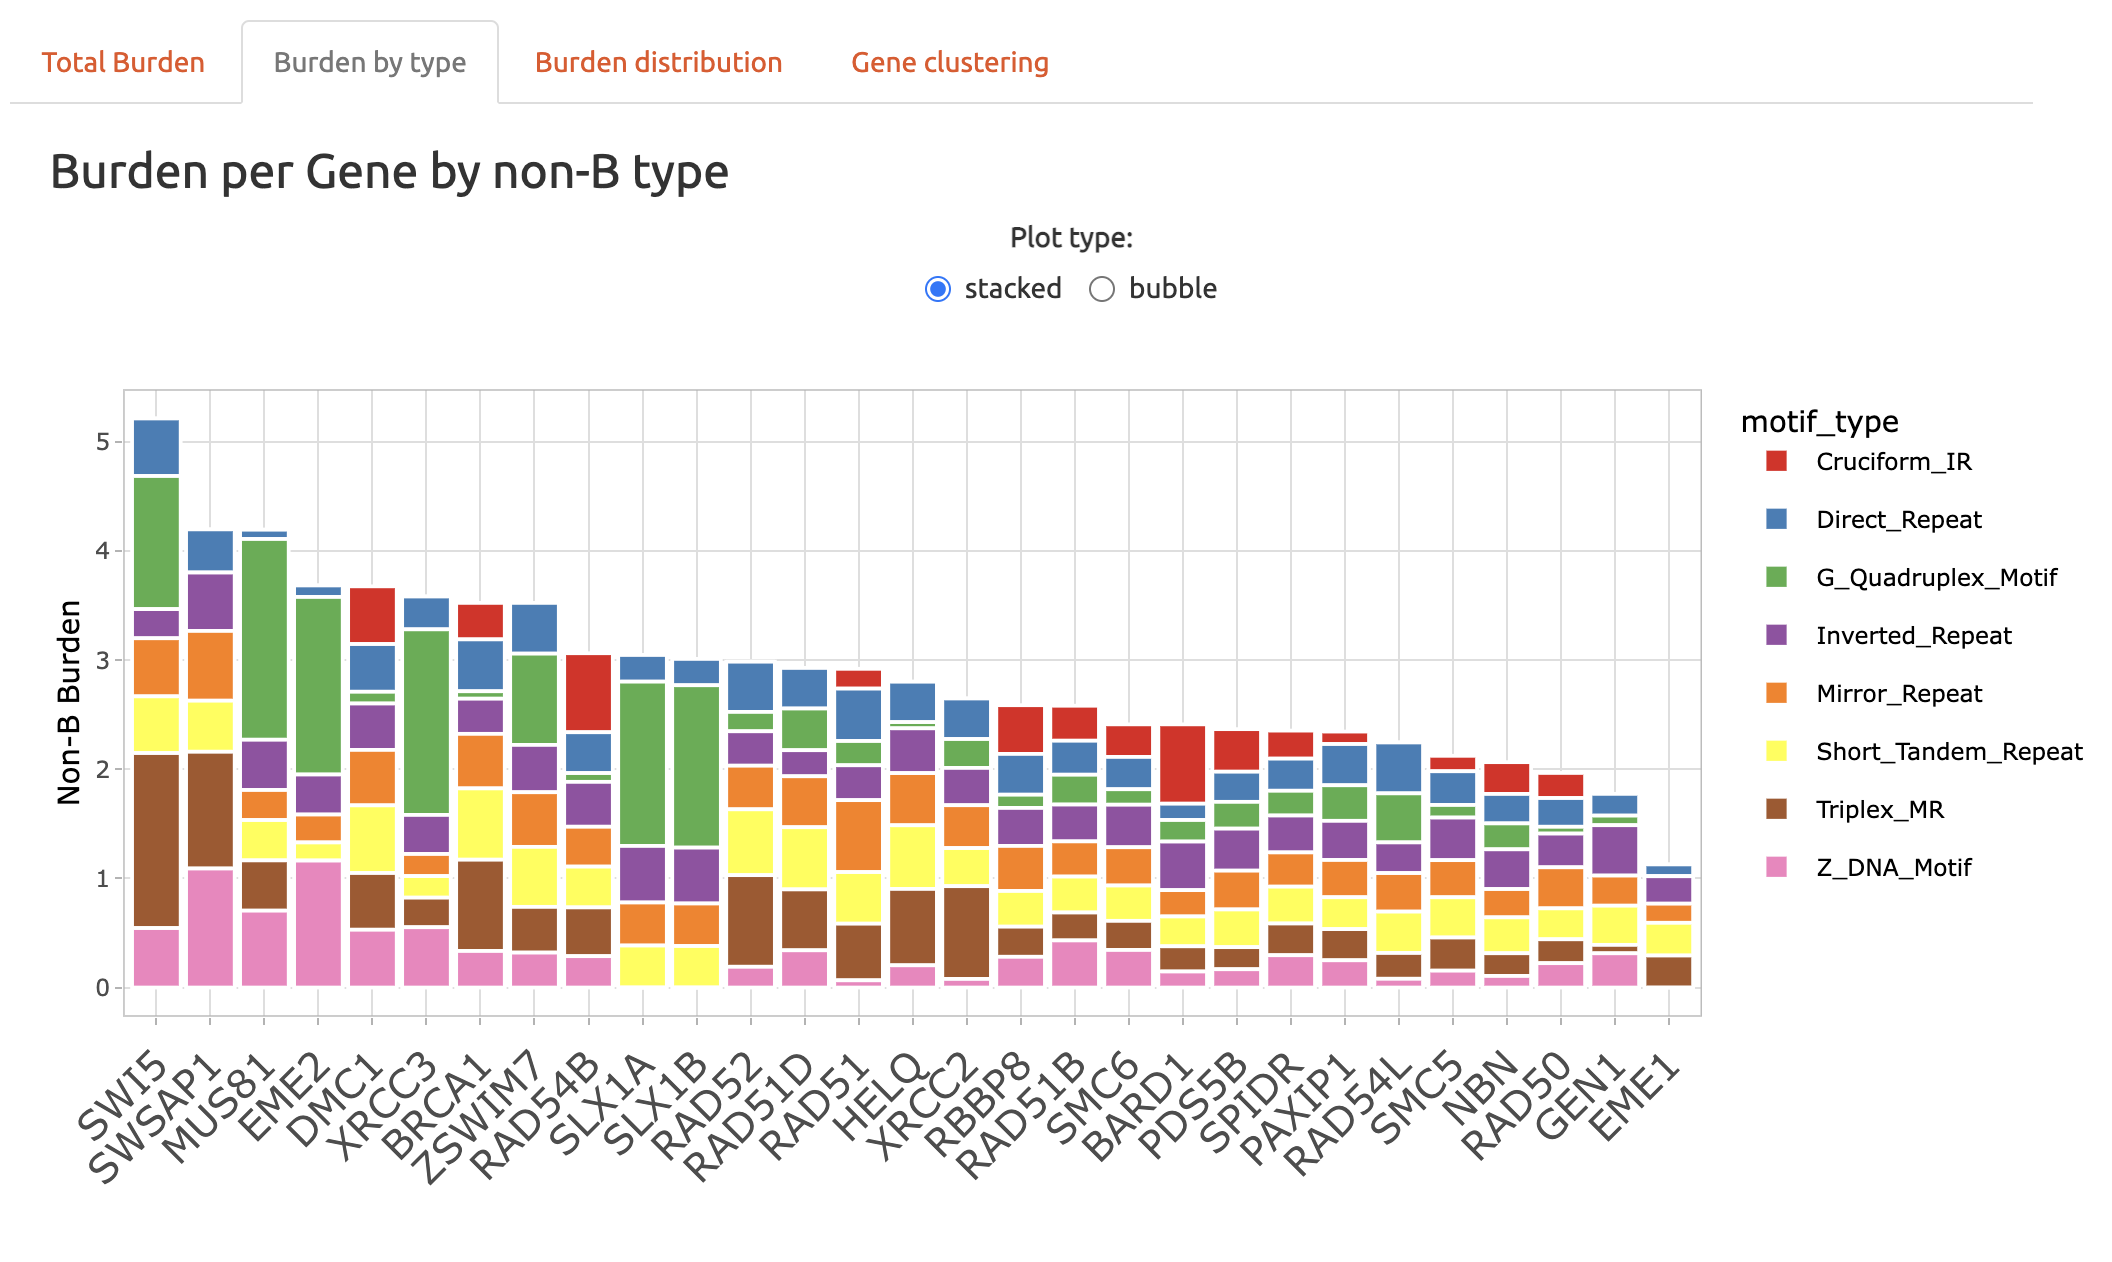
6.2 Burden by non-B type
The stacked bar plot shows the non-B burdens by type for each gene in the query. This allows users to easily compare the non-B burdens across different genes and identify genes with potentially higher burdens from certain non-B structures.
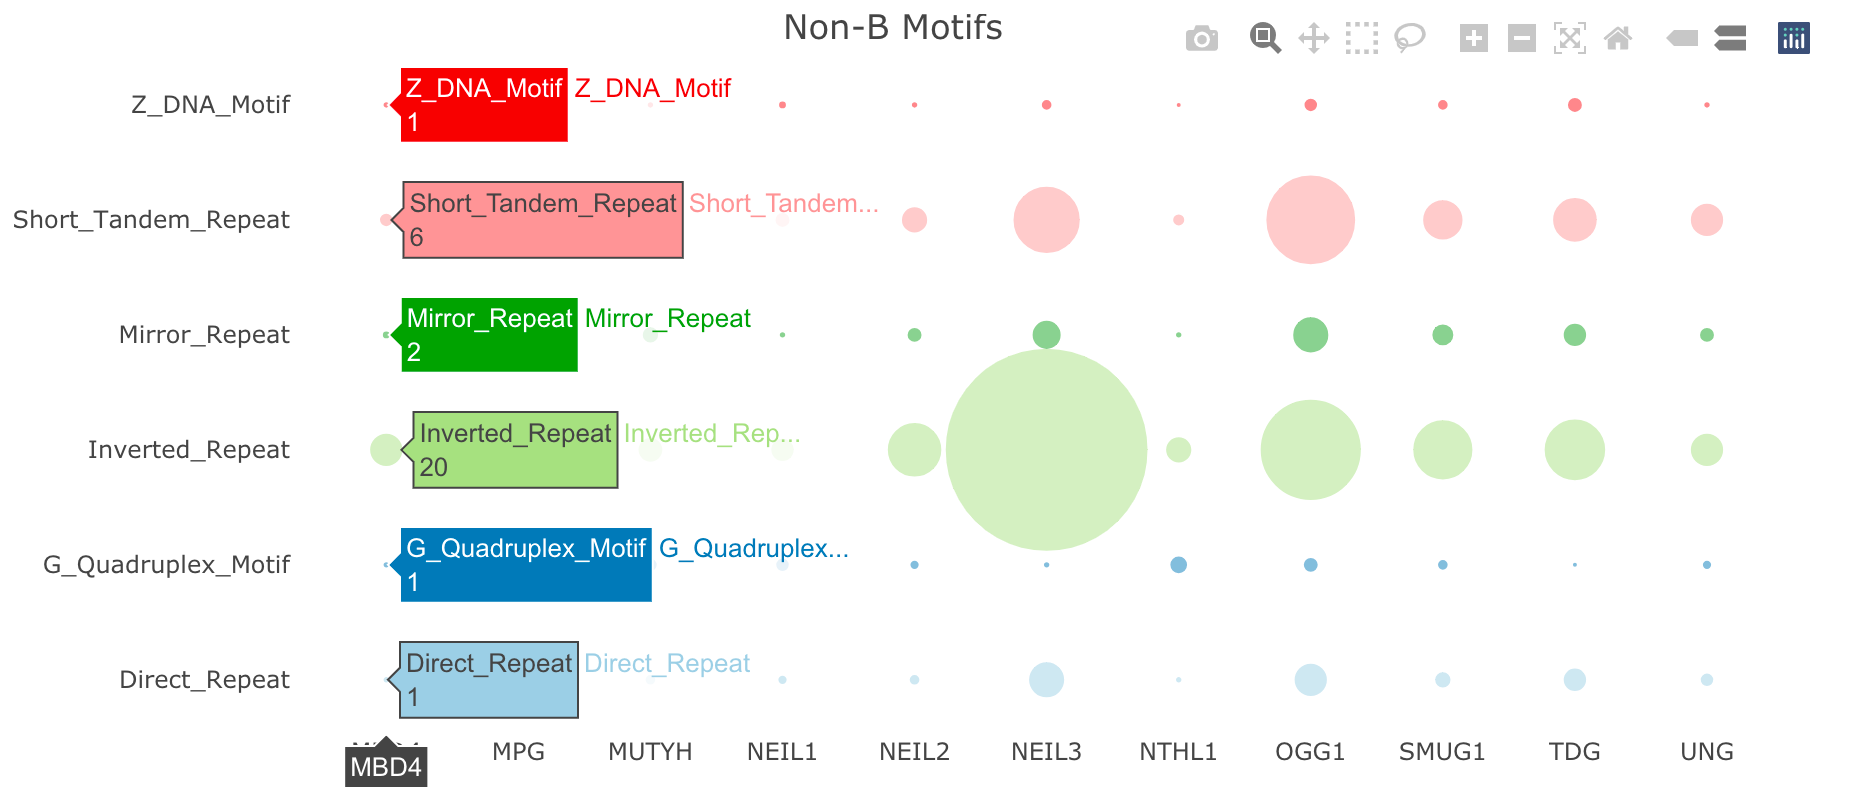
6.2.2 2.2 Bubble plot
Additionally, the dot plot within NBBC is a useful visualization for helping users to select genes with higher burdens by non-B types. This plot provides a quick and efficient means of identifying genes with potentially higher burdens of specific non-B structures, which can aid in the identification of potential targets for further investigation.