5 Input Options
5.1 Region Input
The input region is a partition of the human genome the user wants to find TTSs sequences within. Triplex formation has been shown to modulate expression, inhibit replication, and site-specific mutagenesis (PMID: 18676453). These effects of triplex formation can be targeted to specific genomic locations based on the user’s query.
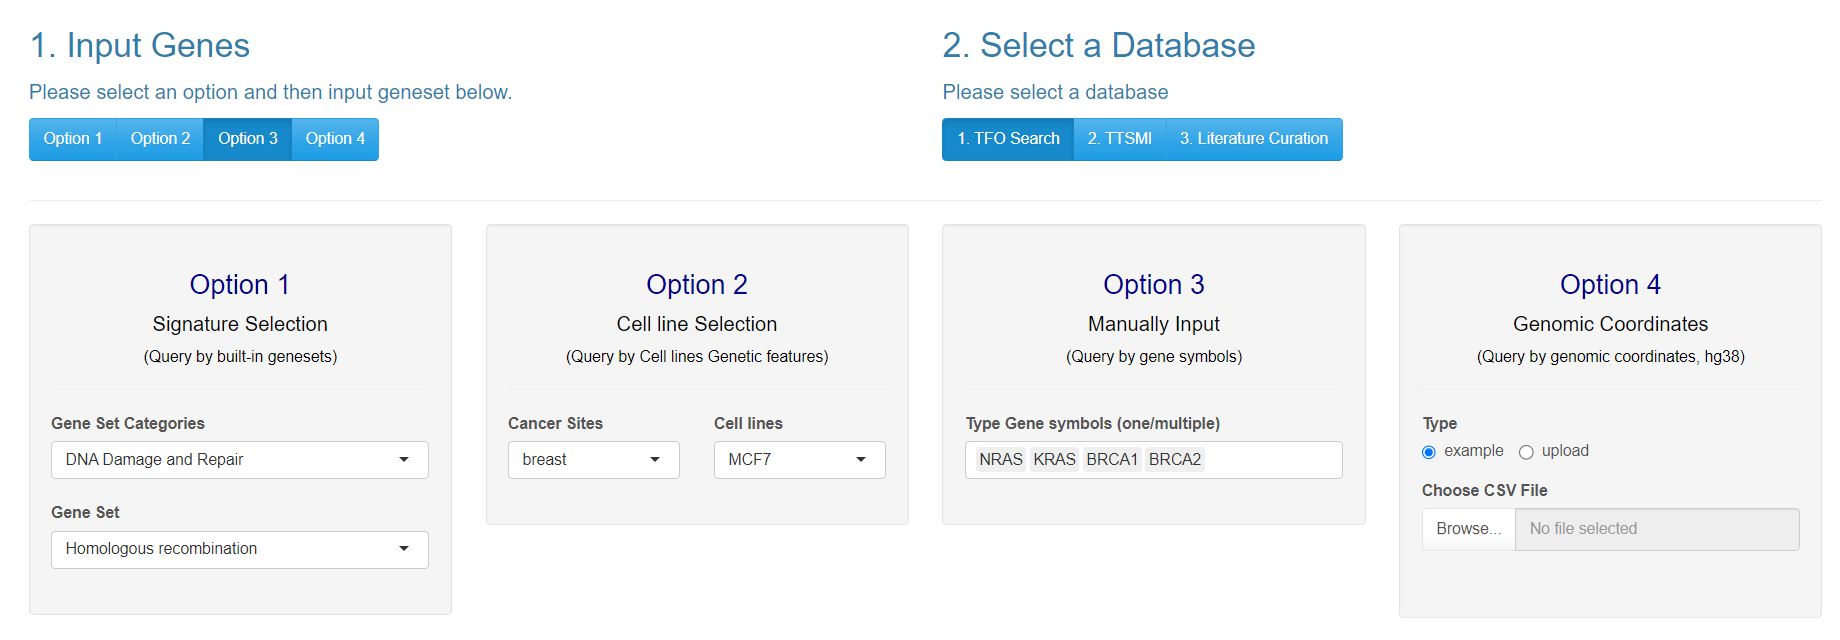
The TTSBBC app accepts region input from four different sources: gene signatures, cell-line amplified segments, custom gene(s/sets/signatures), custom region(s). Below is an overview of them, more detailed information is presented in A5.
- Signature regions: The input includes popular cancer signatures
- Cell Line Amplified Segment regions: This input includes amplified CCLE cell lines segments
- Custom Gene(set) regions: The typical use case is a quick single/multi gene search.
- Custom Genomic Coordinate regions: For custom regions of interest or easy reproducible analyses one can upload a csv file of coordinates.
5.2 Data Source Input
The app also is has multiple data sources. Below is an overview of them, more detailed information is presented in A6.
TFO Search: These TTS sequences were published (PMID: 16764543,PMID: 17013831) their coordinates were updated to Hg38 by alignment to Gencode v44.
TTSMI: These TTS sequences were published (PMID: 25324314) and coordinates were updated to Hg38 by alignment to Gencode v44.
Literature Curation: These are known and wet lab tested TTS sequences that have updated coordinates in Hg38 by alignment to Gencode v44.
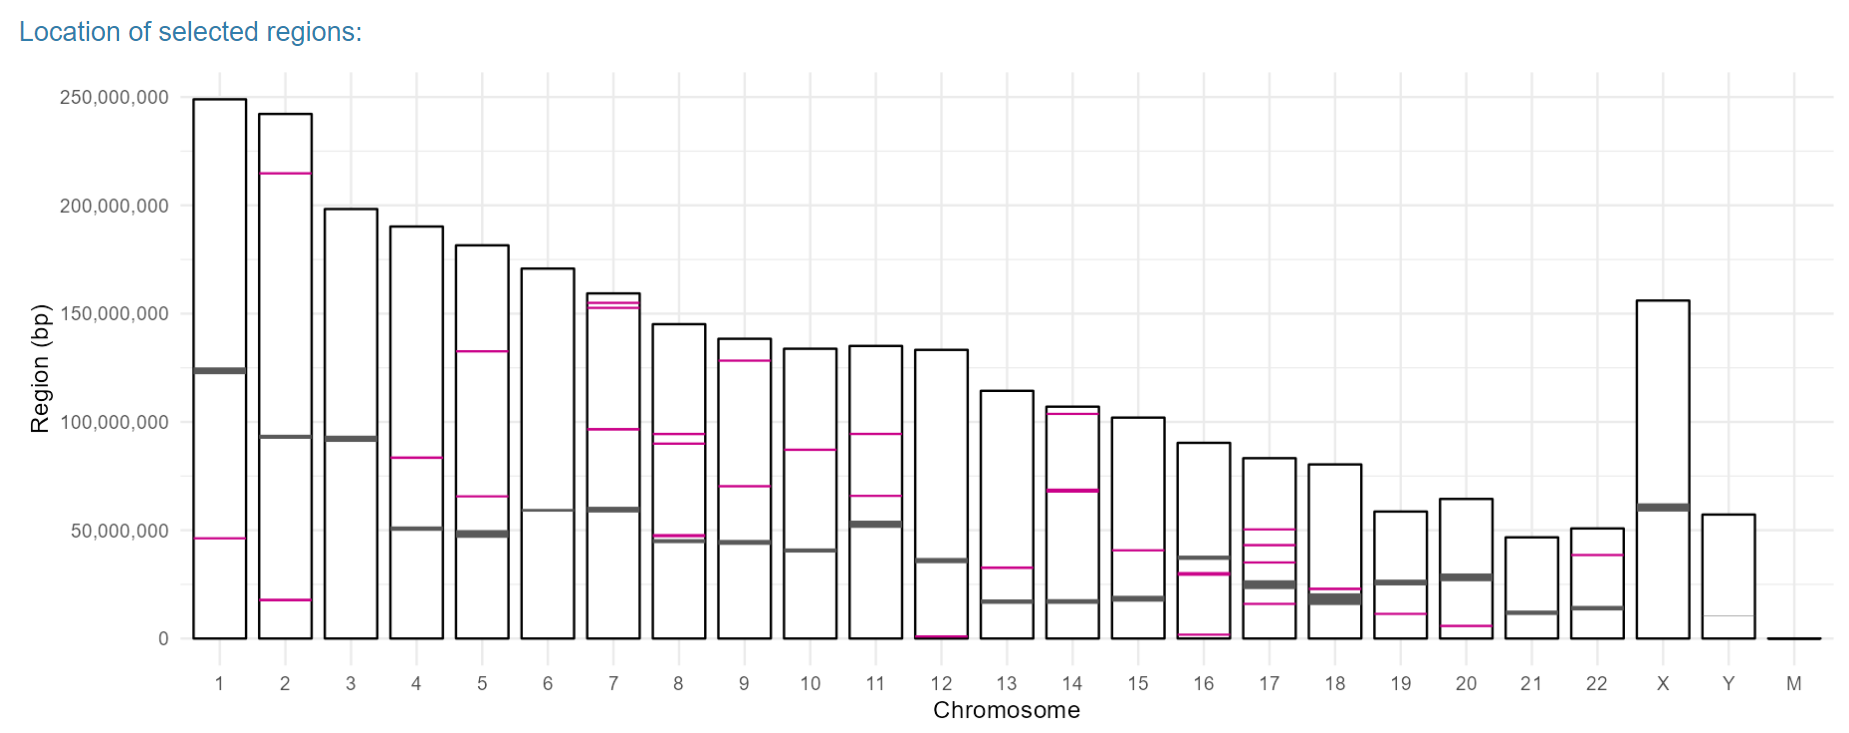
5.3 Query Region Visualization
Once the the region and datasource inputs have been selected, TTSBBC depicts to the user where their query regions are in the human genome. The grey-black bars represent centromere locations from UCSC and the colored bands are the query regions. The query regions are 1Mbp + length of the region for visualization. When using Option 2 for cell line segments the regions are colored by segment mean, more on this in A5: Input formats.
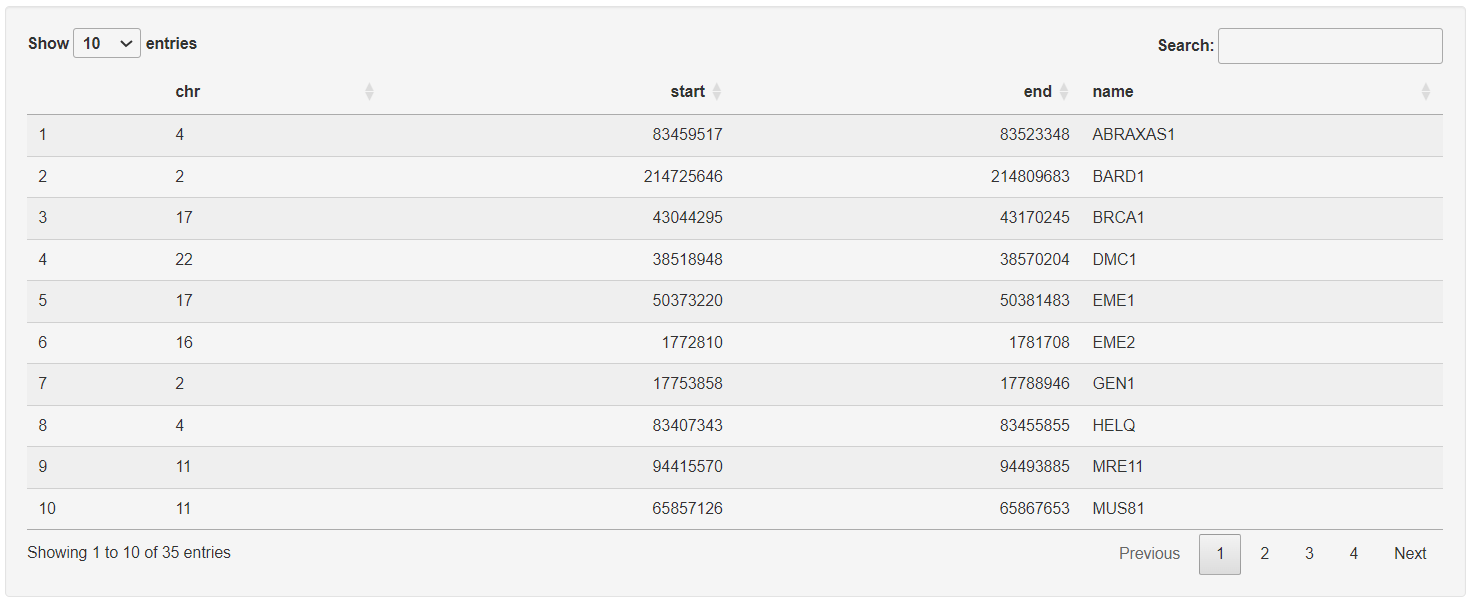
In addition to the visualization a table below the figure is included for users to see all selected query regions. Users can download this table to input back into TTSBBC for a reproduced query at a later date.