26 Spatial Tab
This tab relies on there being a mapping for the input sequence and at least one mismatch. This shouldn’t be a very restrictive requirement, but in the case it is there are currently efforts to make this more dynamic, if you are in need of this feature please reach out to our contact email.
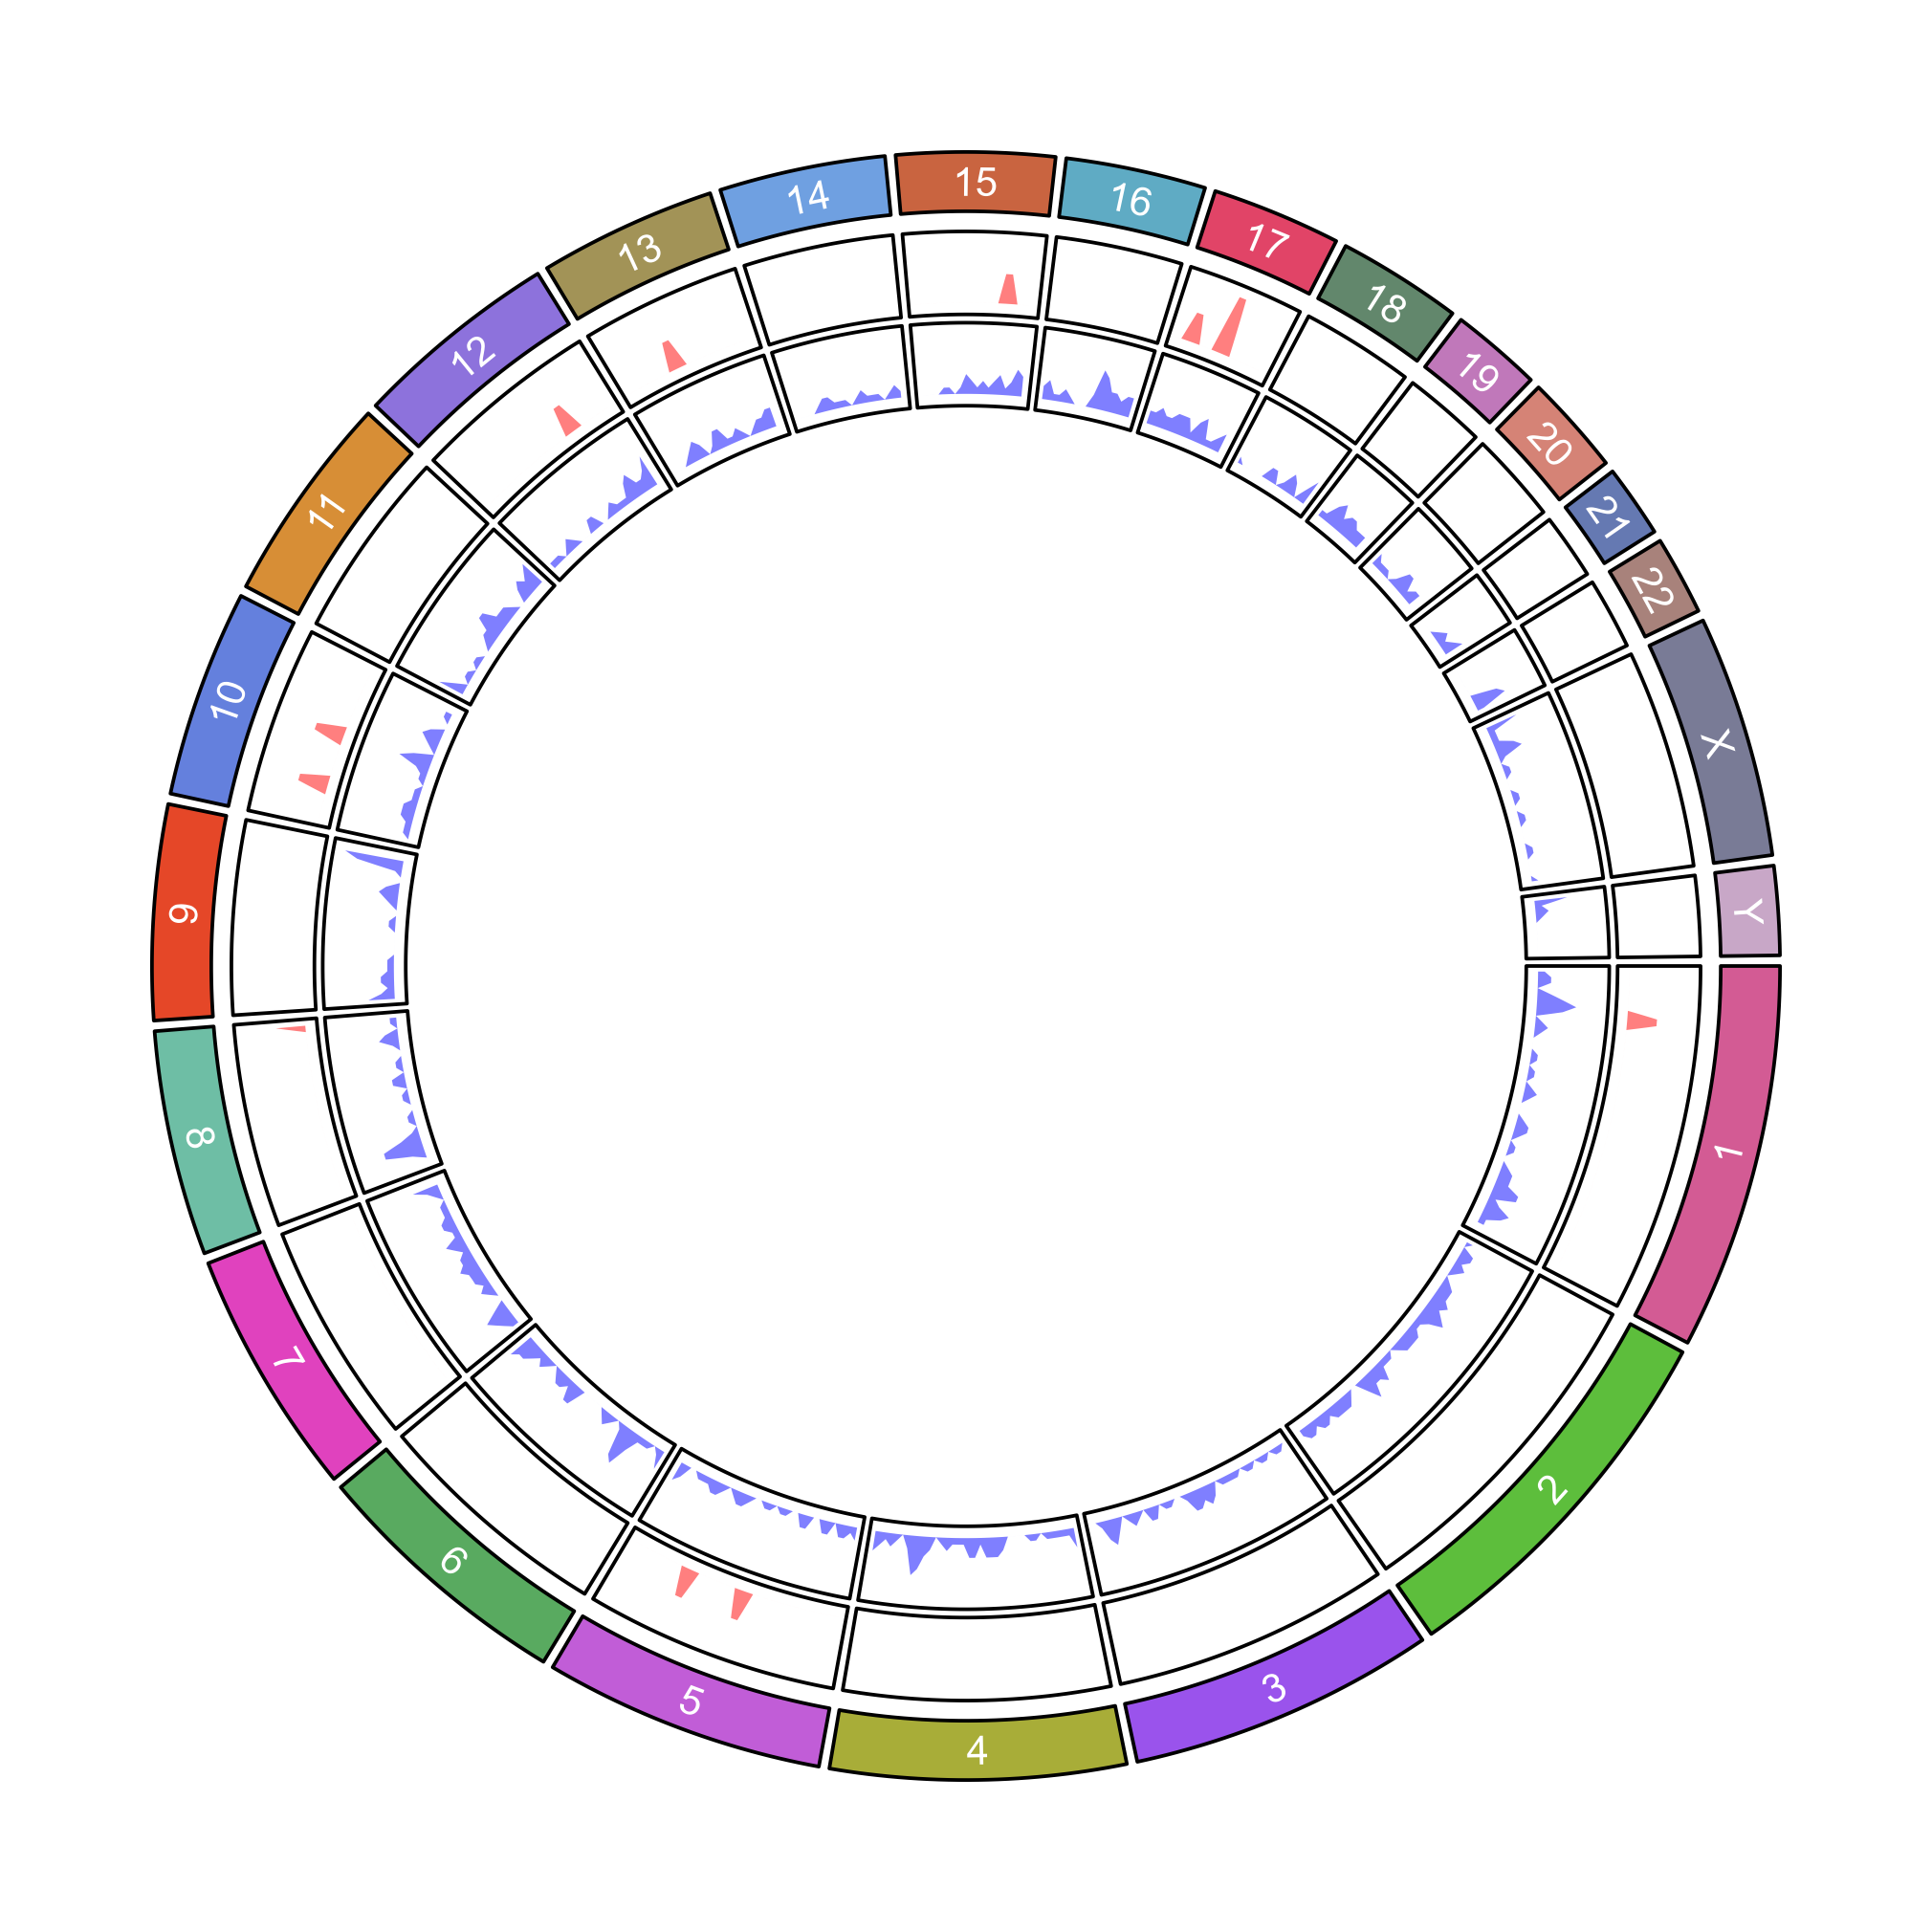
26.1 Circos Plot of mappings and mismatches’ mappings
To visualize the input sequence locations and the mismatch sequence locations a circos plot displays the density of mapping locations for both sets of locations. In the outer ring are each chromosome. The middle ring, moving inwards, are the genomic densities in red of the input sequence. The innermost ring are the genomic densities in blue of all mismatches.
The beginning of a chromosome (i.e. start=0) starts at the most counter clockwise positiion of the chromosome, then the length of the chromosome progresses in a clockwise manner. In other words, as you move clockwise along the circos there is progression from start to end of each chromosome.