9 TTS Network
9.1 Network Inputs
From the query regions, all TTSs that have at least one mapping within the query have their accuracy and precision are calculated, and by default the highest accuracy and precision (euclidian distance to 1,1) are selected for the initial network visualization.
The user can also select a greater or fewer number of TTSs in TTS Targeting (see below) based on different accuracy and precision measures.
9.2 Network Interpretation
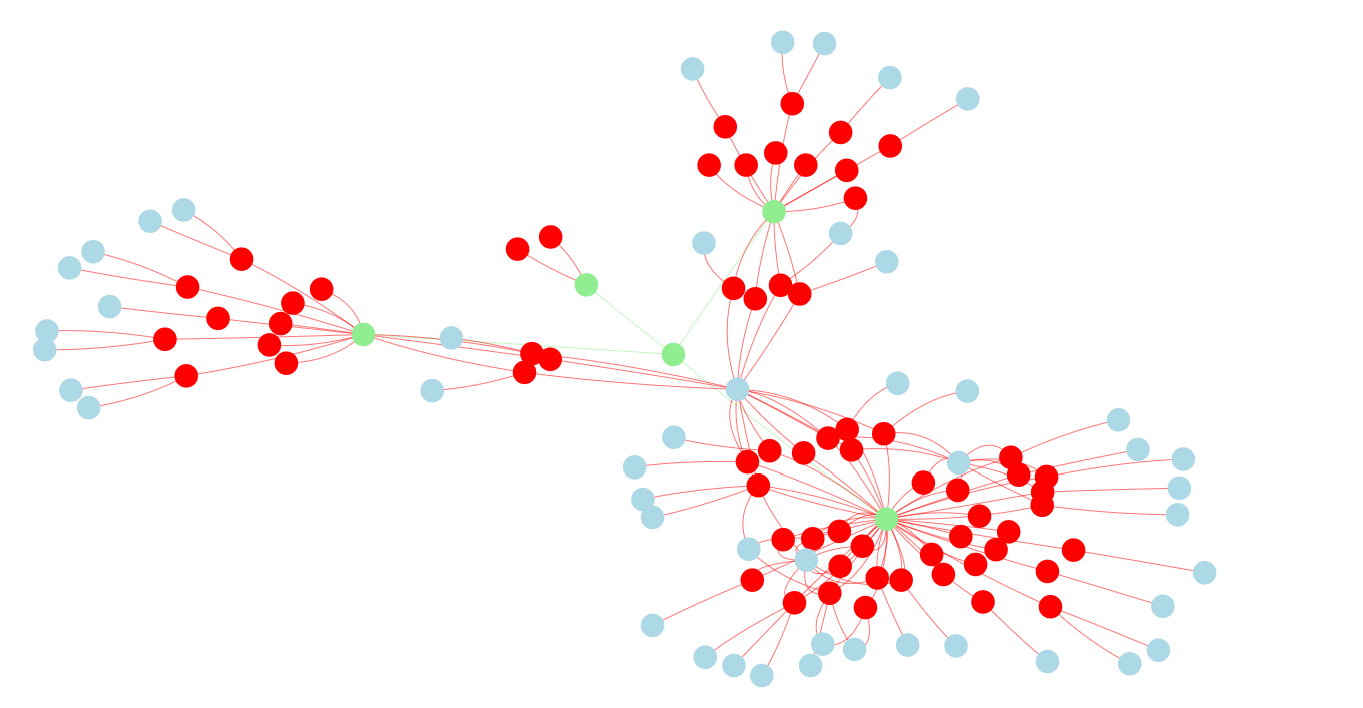
The base of the network are the query regions in green. Each TTS (in red) will connect to a query region with the number of connections equal to the number of mappings. The off target mappings (in blue) will be connected to the TTS. These connections show on and off target mappings for a given TTS and are linked to the accuracy and precision calculations. For clear interpretation, all query regions will be bound to a central node in green.
Below is a large selection of TTSs for a query of NRAS, KRAS, BRCA1, and BRCA2 using Option3. This selection shows a diverse set of TTSs. It shows TTSs with only mappings to target regions and TTSs with many targets one of which is part of the region query. In the next section we introduce ways to quantify these connections in terms of accuracy and precision.