17 TTS clustering
17.1 TTS sequence clustering
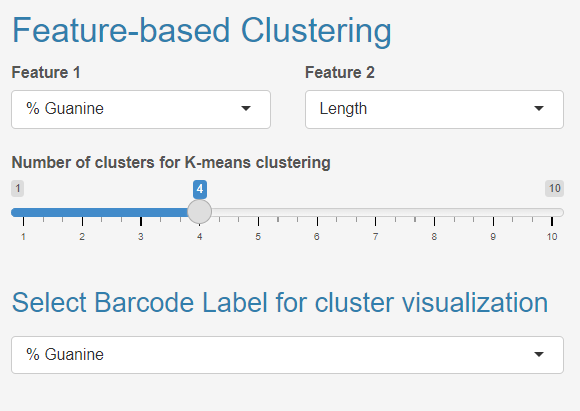
The app allows users to perform clustering on any combination of TTS-associated features, including but not limited to length and guanine content (%G). This capability enables users to conduct a more focused search for sequences with specific characteristics of interest within the context of their research.
17.3 The results:
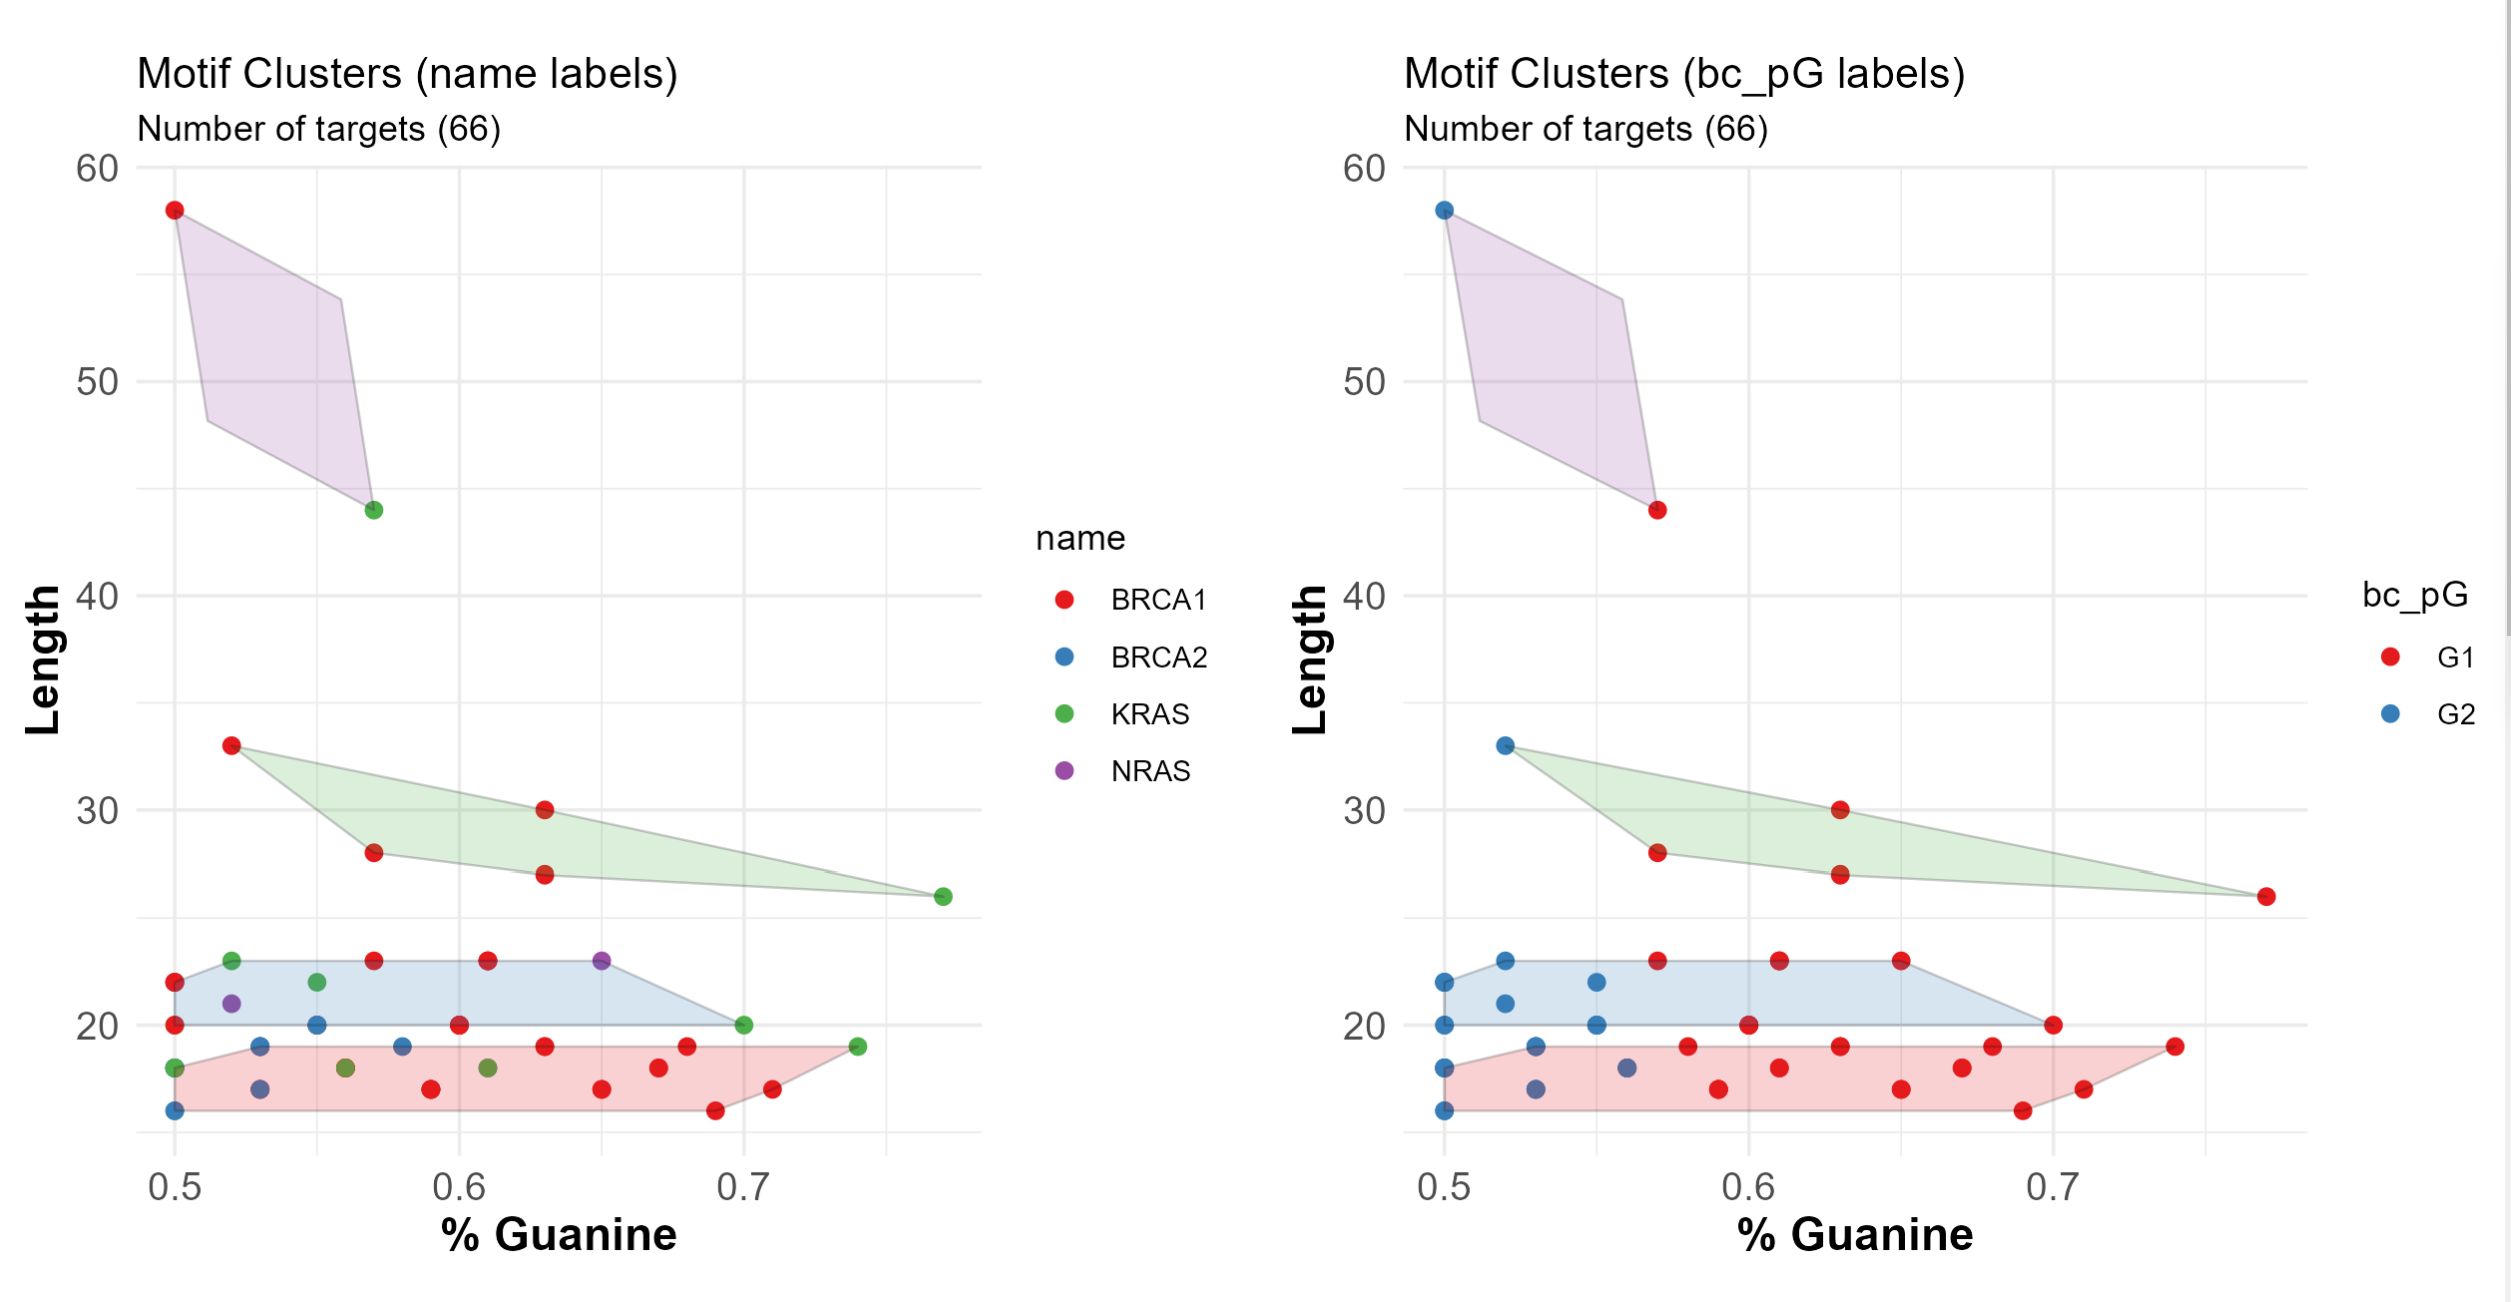
The output of the clustering includes two figures, where TTS are represented by individual dots. The TTSs are in color-coded polygons based on their respective cluster and each point is colored by query region(left) or input barcode feature(right) providing users with relevant information.
17.4 Interactive plots:
The interaction plot feature allows users to select motifs on the graph and view their details. Users can simply click on a motif of interest on the graph, and the app will output the specific details of that motif. Users can also create a selection box to select more than one point on the graph. This feature provides users with a more interactive and efficient means of exploring and analyzing TTS sequences.