25 Mismatches Tab
The goal of this tab is to explore information about all possible mismatches of the input sequence and their genomic locations, features, and differences from the input sequence.
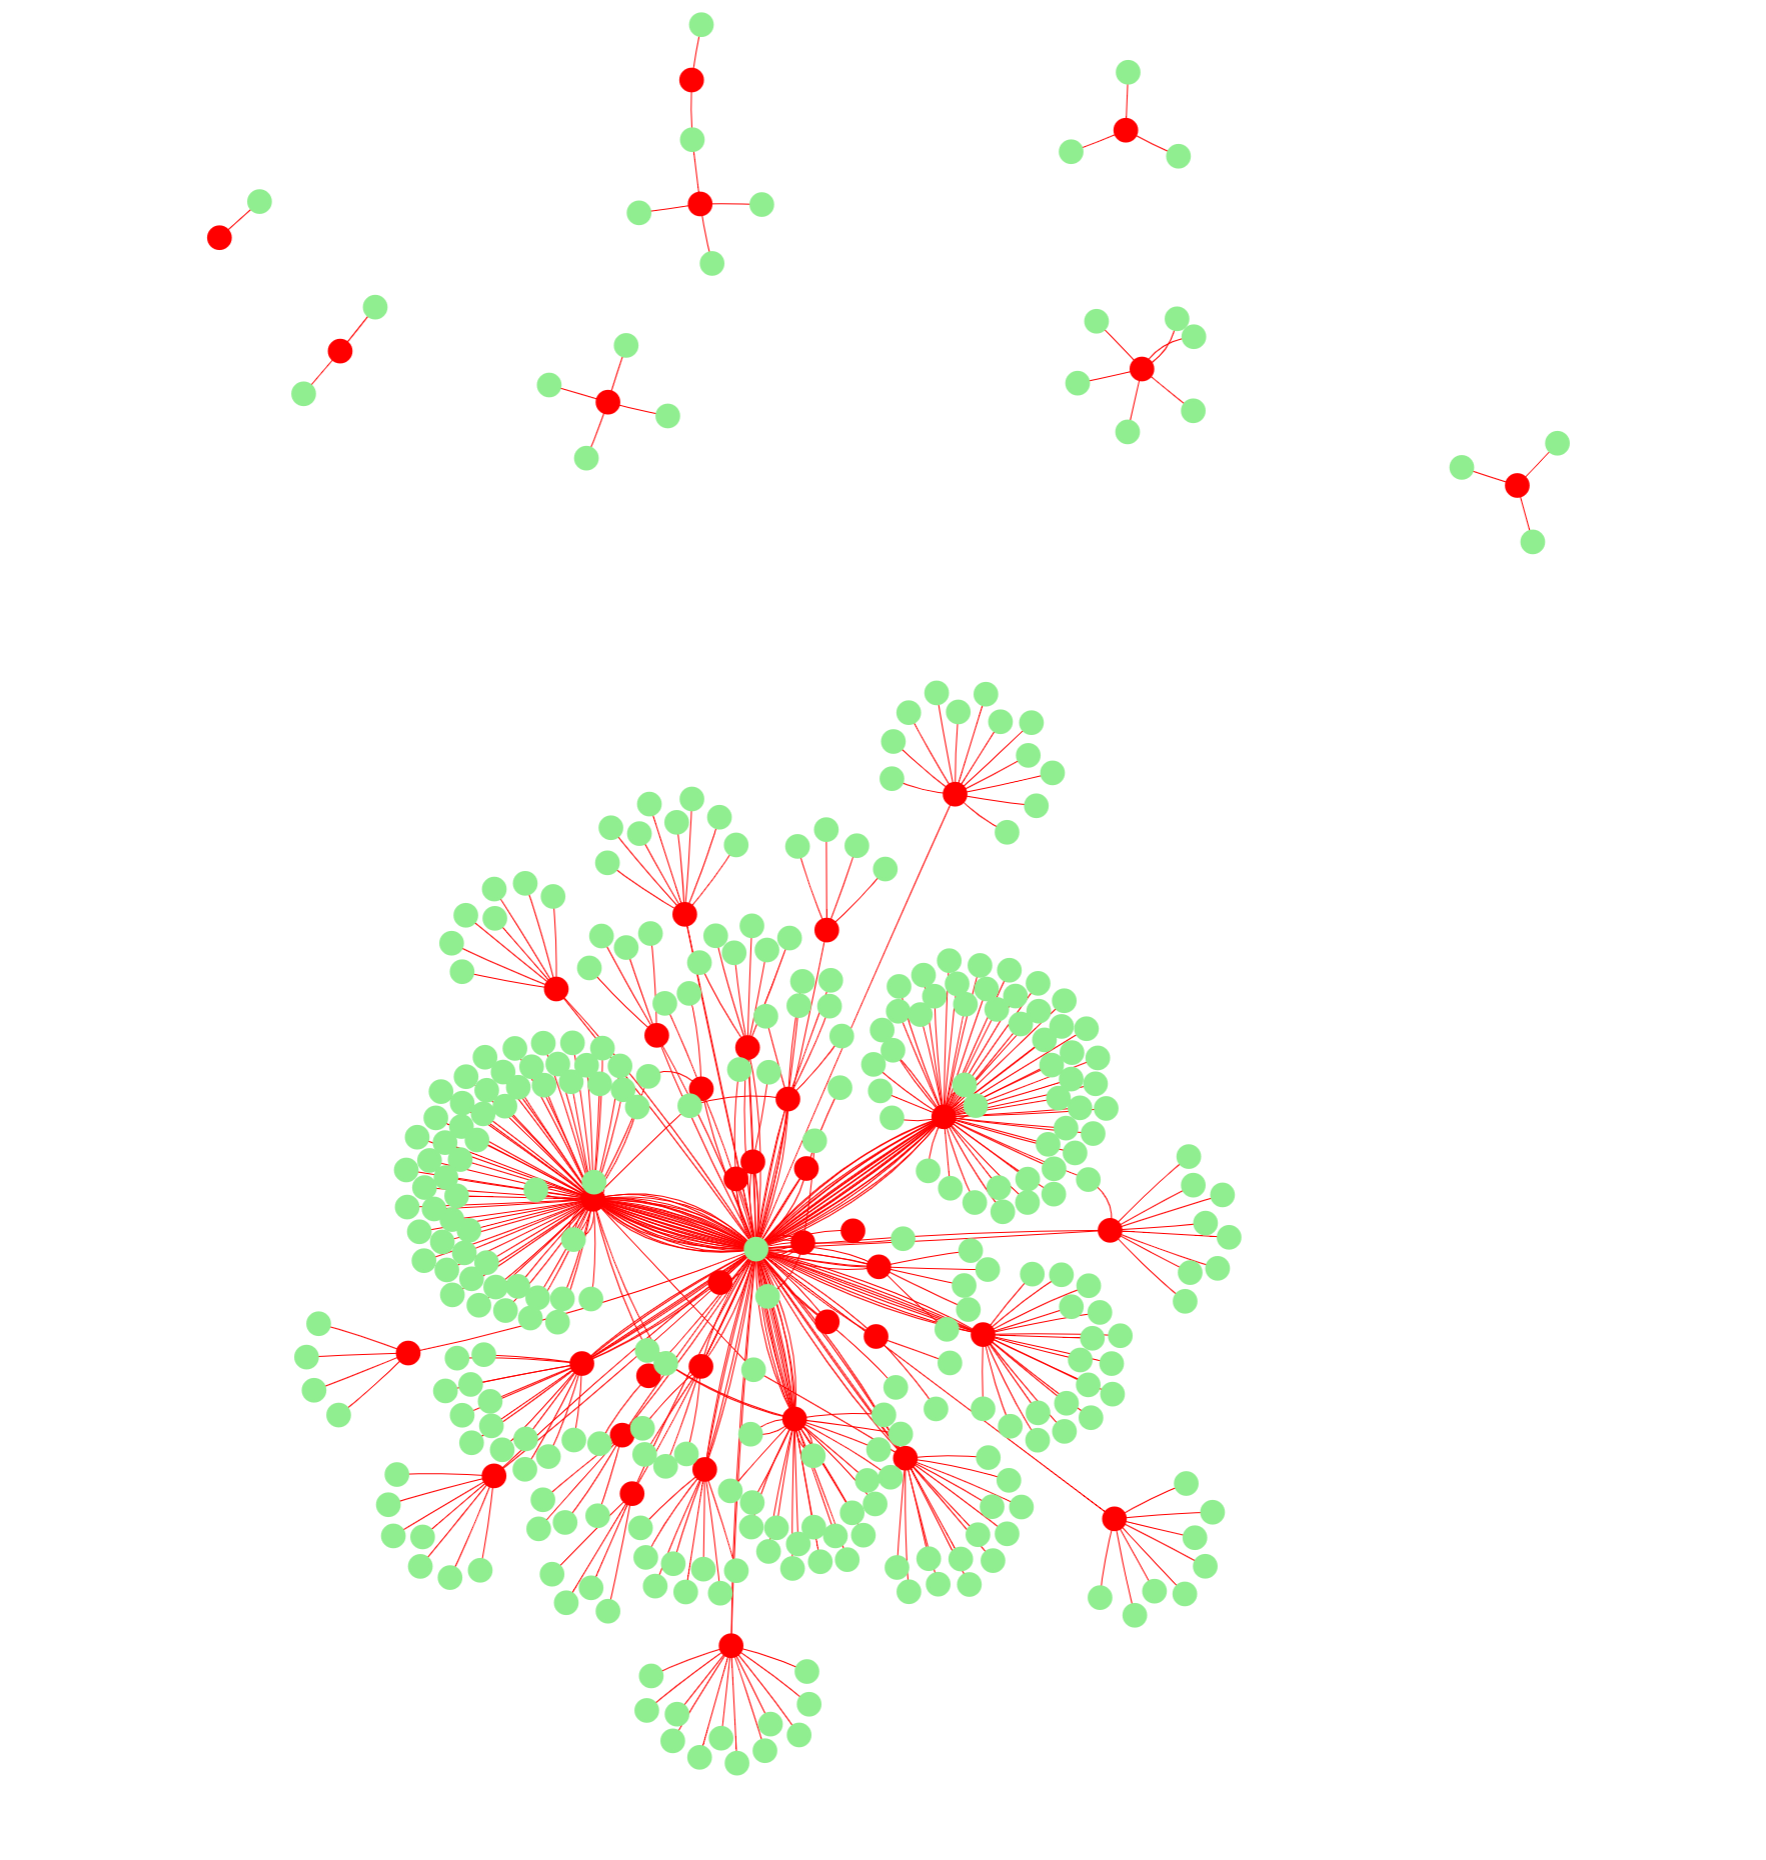
25.1 ‘Mismatch gene profile’ Network
With these calculations of alignment after clicking the “Align mySEQ” button, This network is the same as the one in the “Sequence Tab”. This network visualizes which genes are targeted by the input sequence’s mismatches. In red are the mismatch sequences that have genomic locations, and they are connected to all of their mappings that sequence has in green. The number of connections is equal to the number of mappings to genes. This value may differ from the number of rows in output table below due to duplication of a location that resides in multiple genes.
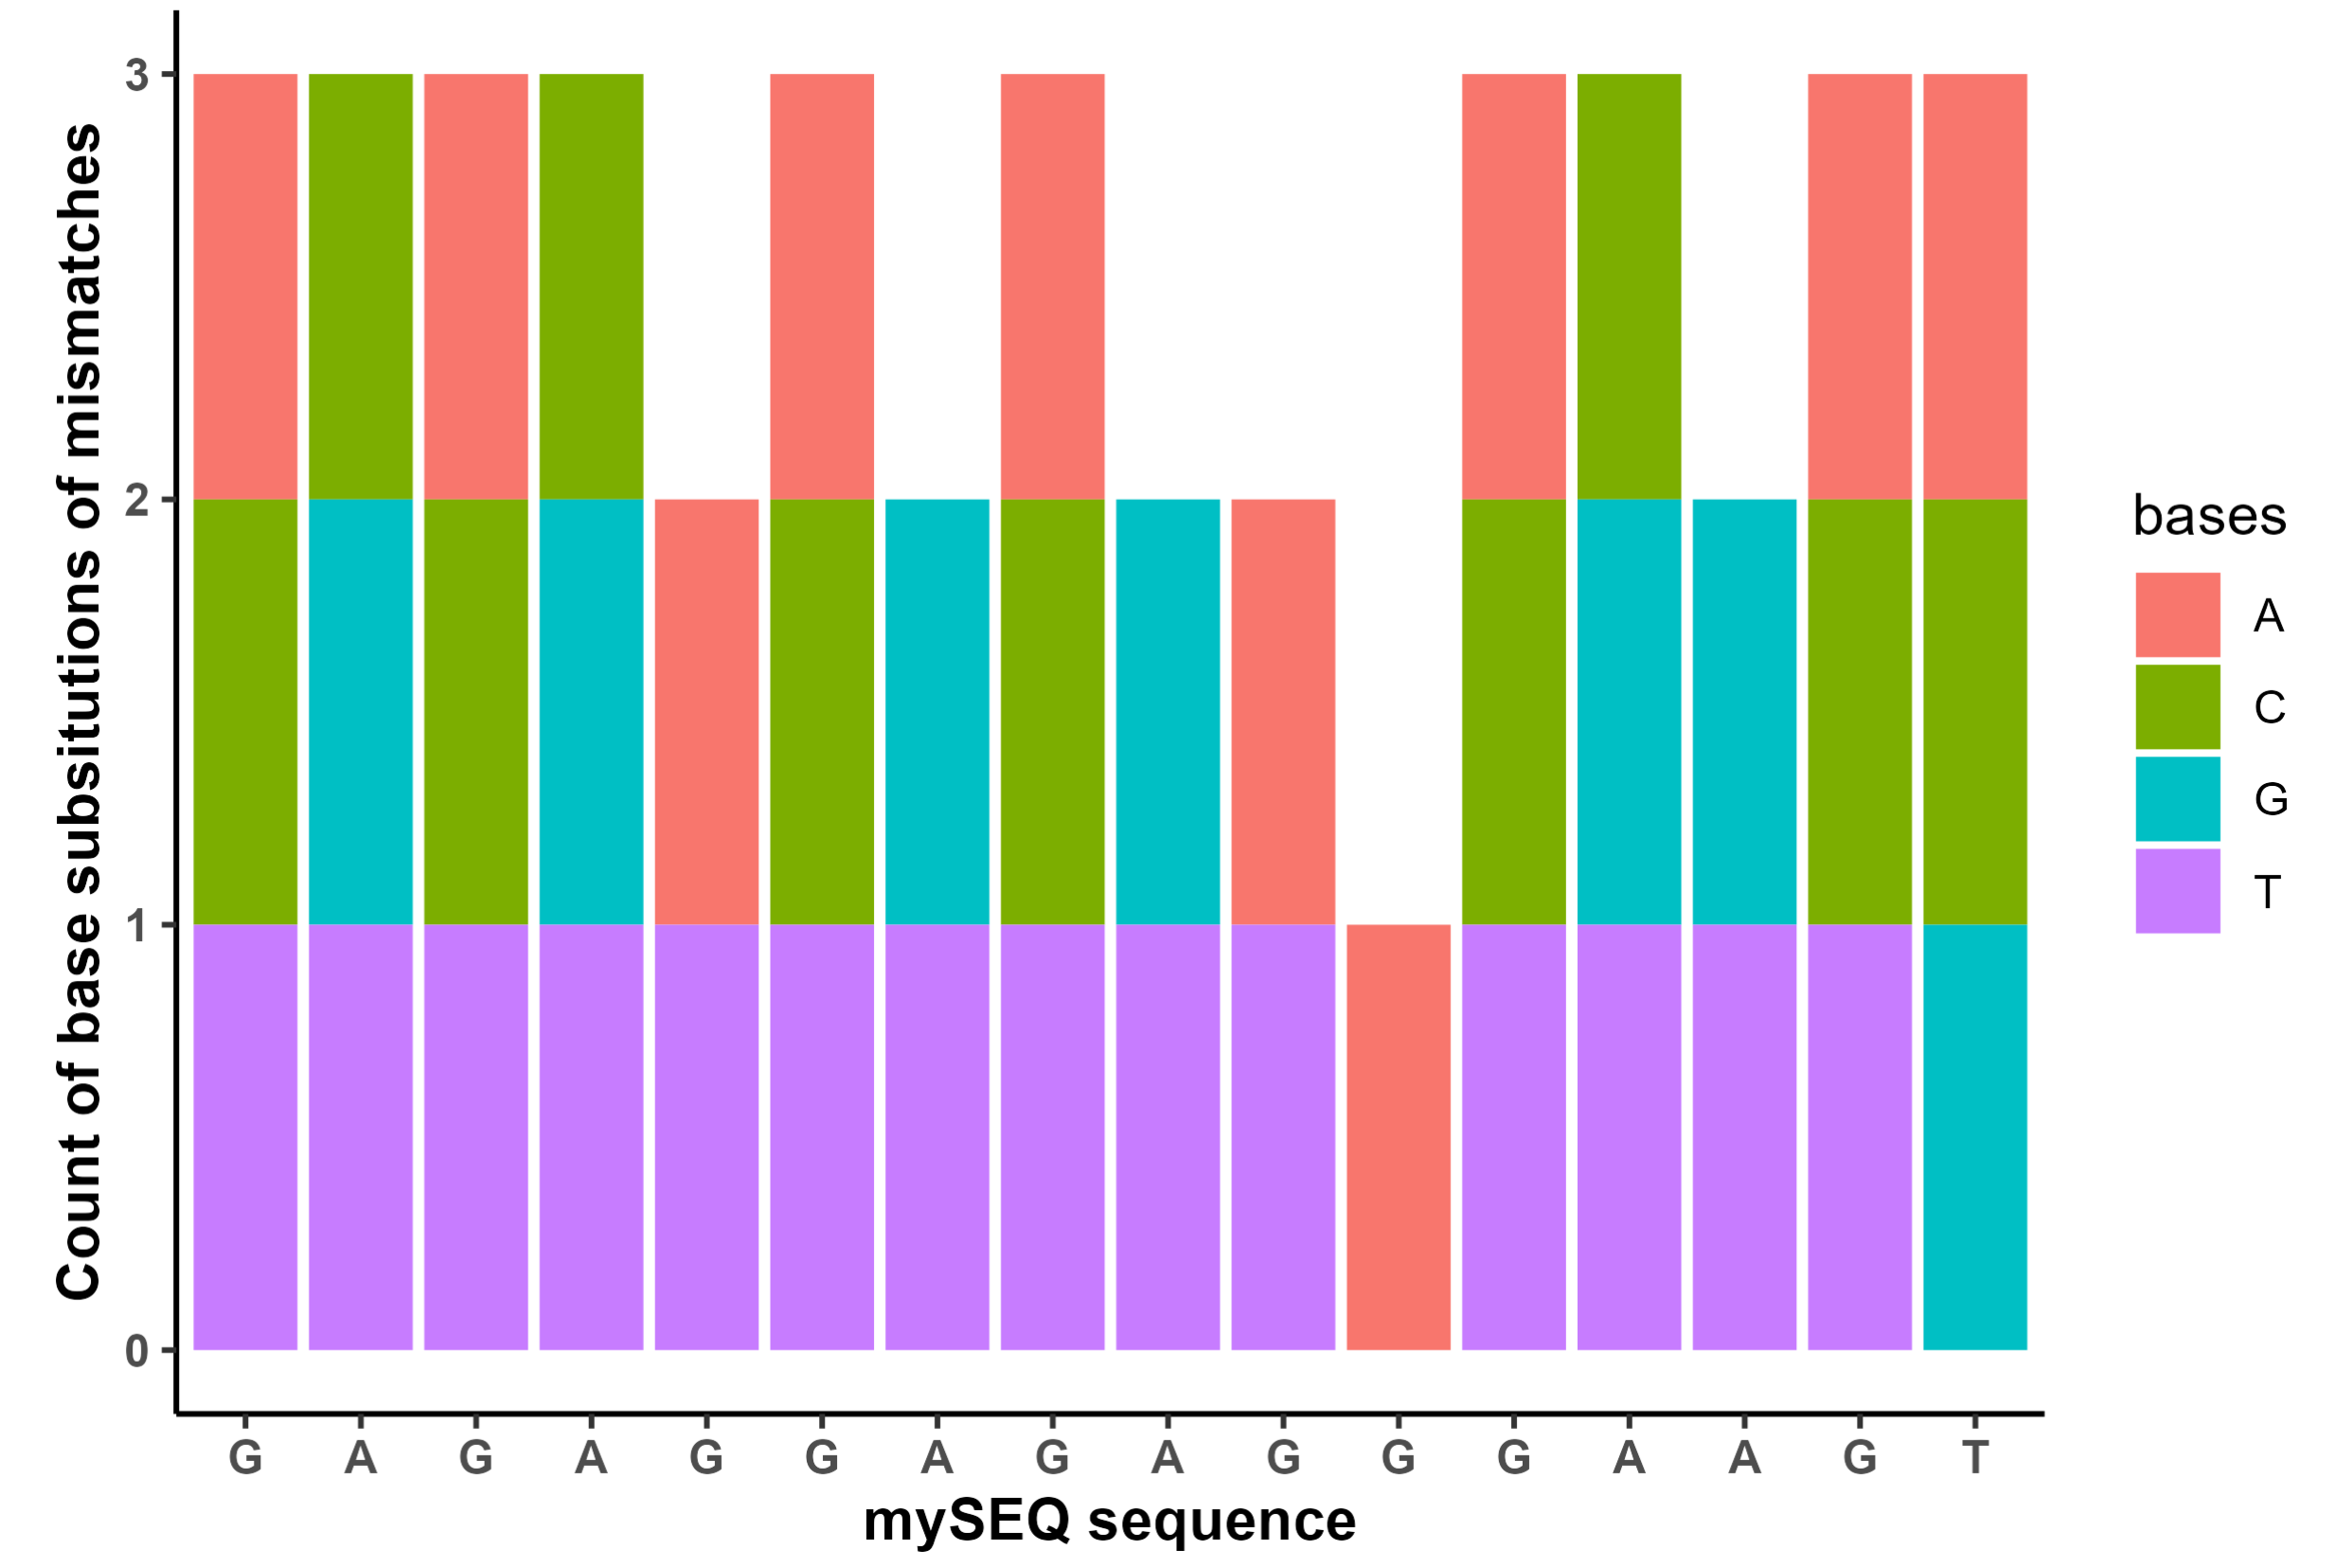
25.2 ‘Mismatch sequence profile’ Stacked Bar Plot
For the mismatch sequences present in the human genome, a stacked bar plot of the base differences to the original sequence to demonstrate the sequence profile of the mismatches. The x-axis is the positions of input sequence with labels displayed as the input sequence’s base value. For each mismatched sequence present in the human genome, which base(s) different from the input sequence are calculated and counted for all mismatches, then are visualized in a stacked bar plot color by the base they became. If each one was a SNP with a from>to format, then the from base would be the x-axis label, and the number of each to base would be the values on the y-axis.
This plot demonstrates genomic sequence similarity and differences and how the sequence is different. This does not take into account insertions or deletions, but only mismatches.
25.3 Output Tables
The first table “Mismatch Alignment Locations” provides a comprehensive list of all genomic locations found for all mismatches, if a mismatch didn’t have any locations it has been ommited from both tables. This table was then joined with gene information that annotates each location with a gene name and corresponding biotype.
The second table “Mismatch Features” provides sequence level feature information about all mismatches with a genomic location inccluding length, content of A, T, G, and C, number of pyrimidines, presence of a G-quadruplex motif, and the number of mappings. In addition the Hamming Distance of each sequence is calculated comparative to the input sequence.