10 TTS Targeting
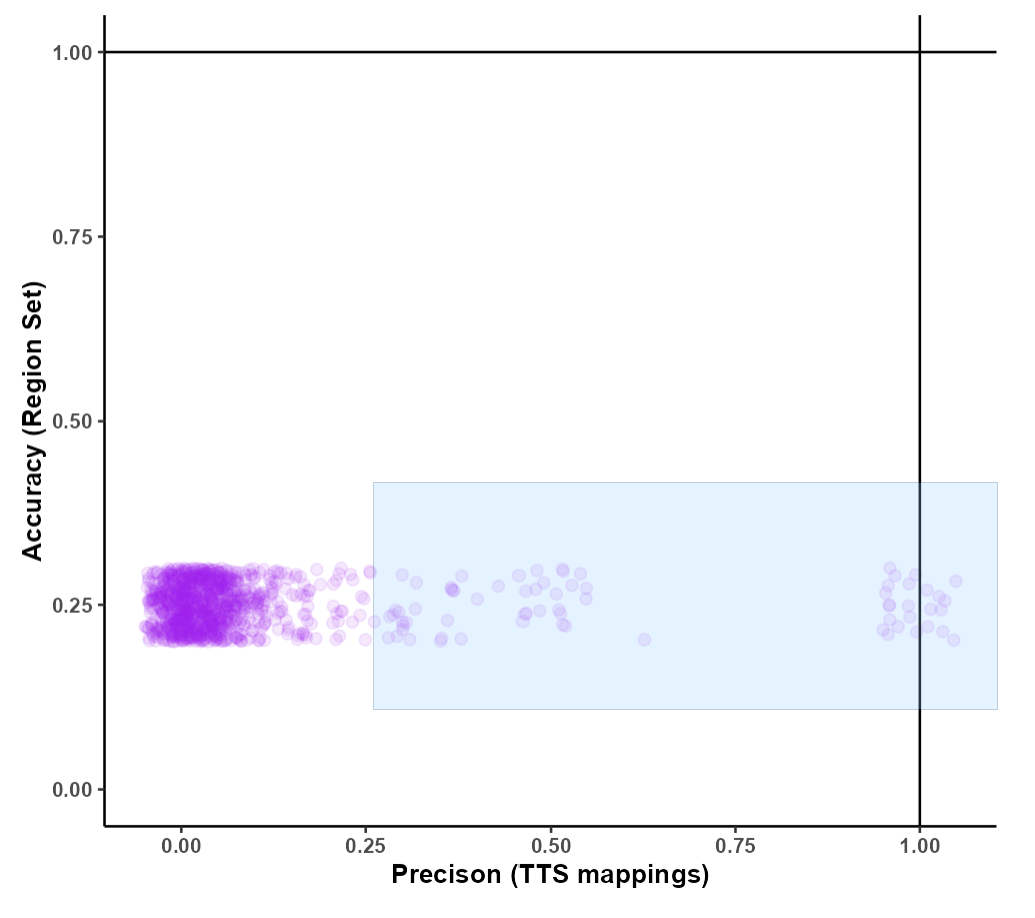
In the scatter plot, each point here represents a single TTS. The points have some “jitter” to them so they do not lie on their exact x,y value. This is so that users can see how dense the number of TTSs are for given accuracy and precision values. On the scatter plot, a user can drag a box to select TTSs. Filtering by the selection is done with the exact values so please note that a TTS can be selected if it is not in the box or a TTS can be in the box and not selected. Further note, that if selecting TTS that have a high number of mapping locations (1,000+ locations noted as num_mappings in the tables below the scatterplot) the network and other features for this app will become slower as the backend data is larger to manipulate and transfer.
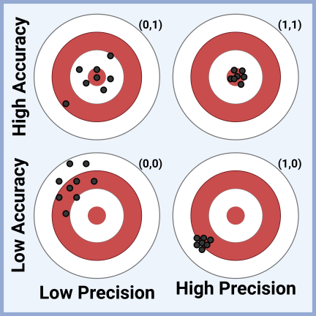
Accuracy and precision are calculated for a given TTS for the query regions. The accuracy is calculated by the number of TTS mapping sites that are in target regions divided by the total number of TTS mapping sites. The precision is calculated by the number of regions with TTS mapping sites divided by the total number of query regions. The accuracy of a TTS defines how on target it is, and the precision of a TTS defines how consistent it is; a visual interpretation using targets of these values is depicted above.
Below the scatter plot are 2 tables. The “Selected TTSs” table indicates which TTSs were selected on the scatter plot. The “All TTSs” table contains all the information for every point on the scatter plot.
Once the “Selected TTSs” table contains the TTSs you are interested in you can click “Choose these TTSs” and it these TTSs will bring you to the next section - Barcoding.