24 Sequence Tab
The goal of this tab is to provide information about the input sequence’s genomic locations and sequence features.
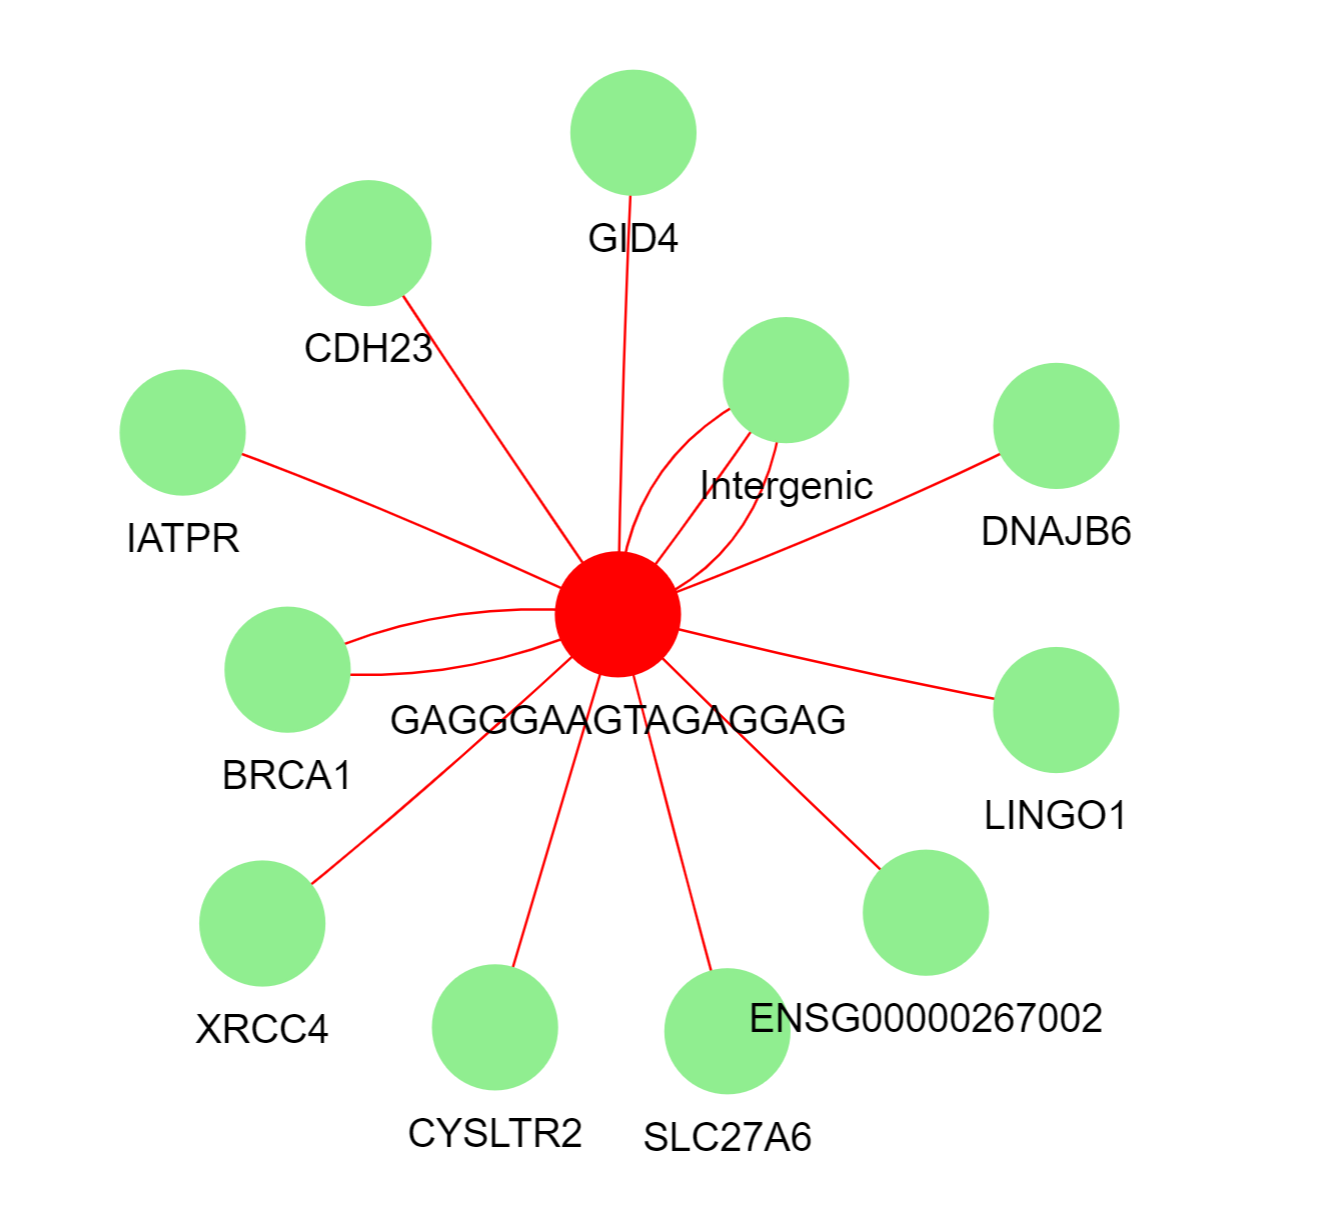
24.1 Network
With these calculations of alignment after clicking the “Align mySEQ” button, “mySEQ” provides a network of which genes are targeted by the input sequence. In red is the input sequence, and the input sequence is connected to all of the mappings that input sequence has in green. The number of connections is equal to the number of mappings to genes. This value may differ from the number of rows in output table below due to duplication of a location that resides in multiple genes.
24.2 Output Tables
The first table “TTS Alignment Locations” provides a comprehensive list of all genomic locations found. This table was then joined with gene information that annotates each location with a gene name and corresponding biotype.
The second table “TTS Features” provides sequence level feature information about the input sequence inccluding length, content of A, T, G, and C, number of pyrimidines, presence of a G-quadruplex motif, and the number of mappings